Google's parent company, Alphabet (NASDAQ:GOOG) is scheduled to report Q4 201 earnings after market close for the fiscal quarter ending December. The forecast calls for a $10.88 EPS—up from last year’s corresponding $9.7 EPS for the same quarter—and $38.91 billion revenue, up from $32.32 billion revenue posted last year during the same quarter.
Google) has beaten estimates 75% of the time in the last two years.

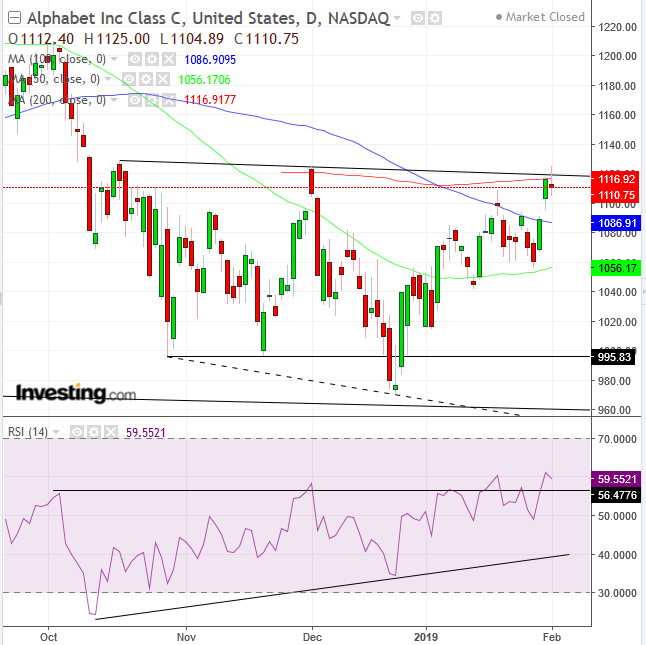
Alphabet has been ranging since October 17. Friday’s close tested the trend line that connects the highs of the price action, which it crossed only on an intraday level, while closing below it, confirming its significance. At the same time it also attempted to break above the 200 DMA, but closed below it, reinforcing the $1,120 as a line the bears aren’t willing to give up.
However, if the bulls do overcome resistance, they will have completed a triple bottom, turning the previously-mentioned trend line connecting the highs into a neckline.
The RSI provided two positive divergences: the price scale to the highest since the consolidation, which suggests the price will breakout too; and the momentum has been picking up between October and December, increasing the likelihood that the falling price action during that time might follow momentum higher.

However, when taking a longer view, via the weekly chart, we realize that the potential triple-bottom on the daily chart is the left shoulder of a potential massive H&S top, forming since January 2018.
The weekly RSI supports the falling trend, and stochastics are about to trigger a sell signal, curving downward from an oversold condition. This dichotomy beautifully projects the short-term bullishness since the post-Christmas rally, and the medium-term bearishness.
While no one knows whether the short-term will become the new medium-term, heading upward, or whether it will realign with the downward medium-term, traders could initiate a long trade—cautiously—in the short-term.
Trading Strategies
Conservative traders should wait for the various trends to agree.
Moderate traders may enter a long position, if the price breaks out of the range. They would do well to employ a minimum 2-percent penetration till above $1,140., to avoid a bull trap. Then, wait for the price to firm above the congestion, with at least one long, green candle following a red or small candle of either color.
Aggressive traders may go long now, relying on the 75% statistical chance the company will beat expectations, triggering a general market euphoria, thanks to a perceived dovish Fed, positive trade and earnings momentum.
Trade Sample
- Entry: $1,120
- Stop-Loss: $1,115
- Risk: $5
- Target: $1,200
- Reward: $80
- Risk-Reward Ratio: 1:16
