If UK regulators approved the use of AstraZeneca's (NASDAQ:AZN) COVID-19 vaccine on Dec. 30, and began administering it this past Monday—becoming the first country in the world to do so—why are shares of the London-based pharmaceutical giant heading lower?
Stocks have been hitting record after record because of the vaccines, so shouldn’t a vaccine maker be lifted as well? Yesterday, in a post about Pfizer, we argued that the current decline in pharma stocks is due to profit-taking.
However, it should be noted that while we're bullish on Pfizer (NYSE:PFE) as well as Moderna (NASDAQ:MRNA), maker of the other vaccine currently in global distribution, we're bearish on AstraZeneca, but not because of its vaccine's potential.
After announcing on Dec. 16 it was purchasing Alexion Pharmaceuticals (NASDAQ:ALXN) in a $39 billion cash and stock deal, shares of AZN started dropping. The stock fell 7% from its Dec. 8 close of $54.72.
At the same time, Axion enjoyed a rising gap and 29% gain. It’s obvious what investors think of the deal, and which company they believe was the bigger beneficiary from the transaction, which raised eyebrows considering the two drugmakers operate in very different spheres. While AstraZeneca deals with common illnesses, Alexion produces therapeutics for rare diseases.
Still, AstraZeneca is down only 12.5% from its Dec. 8 close, while Pfizer is off 13.4% and Moderna is lower by 31.6%—and the latter two companies have no bad deals currently on their books. So, why are we bearish on AZN?

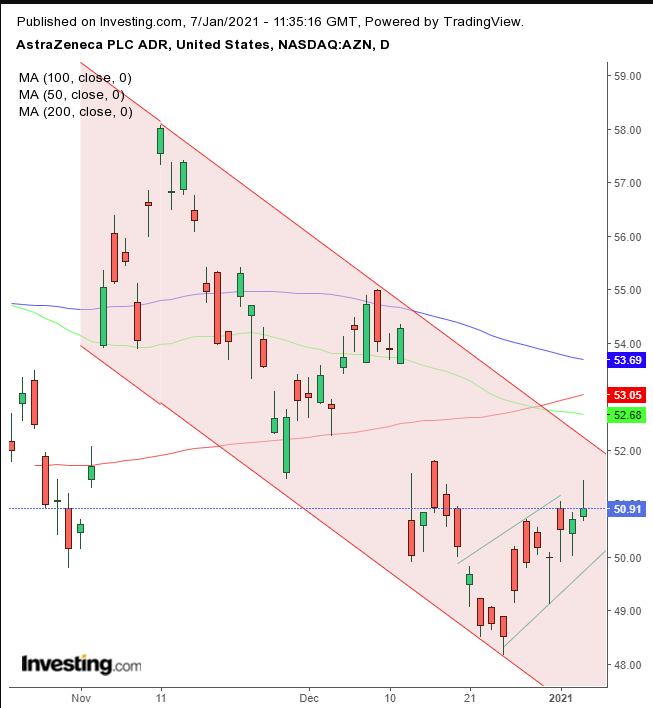
Yesterday, the stock formed a shooting star at the very top of a bearish flag, near the top of a falling channel, after the 50 DMA crossed below the 200 DMA, triggering a death cross.

Chart powered by TradingView
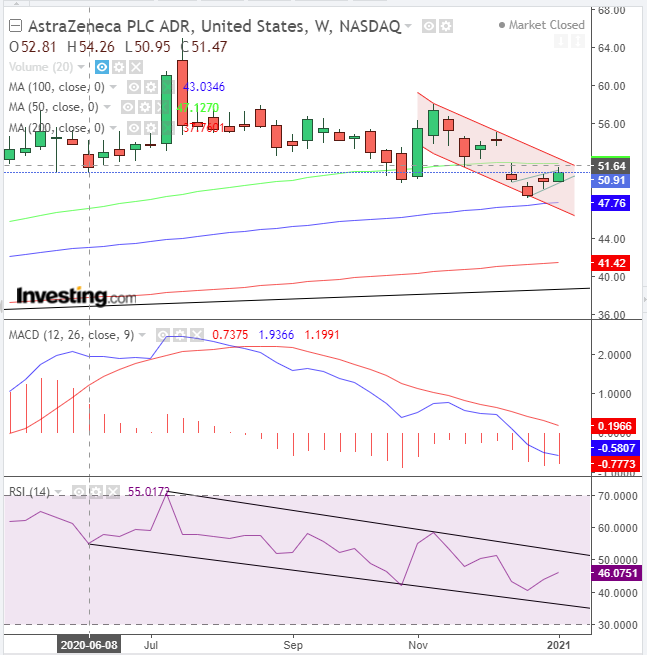
Taking a longer view we note that this triple resistance of the shooting star, flag top and falling channel top—after the death cross—occurs at the very same level of the neckline of a large H&S top since May 2018, with the added resistance of the 50-week MA.
The H&S top’s implied target is $14, bringing it face-to-face with the long-term uptrend line since the 2016 low. While the 50 WMA provides resistance, the 100 WMA is support, and the 200 WMA will support the long-term uptrend line.
Finally, confirming the bearish aspect, the weekly MACD and RSI are in clear bearish trajectories.
Trading Strategies
Conservative traders would wait for the bearish flag to complete, with a downside breakout, followed by a return move to confirm the pattern’s validity.
Moderate traders are likely to wait for the same flag completion and return move, but for a closer entry, and not necessarily for a confirmation.
Aggressive traders could short at will, provided they planned their entry and exit points, based on the supports and resistances, that provide a favorable risk-reward ratio.
Here’s an example:
Trade Sample
- Entry: $51
- Stop-Loss: $52
- Risk: $1
- Target: $48 – December low
- Reward: $3
- Risk:Reward Ratio: 1:3
