- Bitcoin broke the consolidation phase post-ETF approval, and now the spotlight turns to today's trading.
- The impact of spot Bitcoin ETF approval and global economic data is set to be felt.
- The crypto could retreat before mounting an attack on the 48,900 resistance, targeting $50k.
- Looking to beat the market in 2024? Let our AI-powered ProPicks do the leg work for you, and never miss another bull market again. Learn More »
This week, Bitcoin reached a significant milestone as the spot Bitcoin ETF finally gained approval, a process that took a decade to pay out.
The expectations that had been building up in the second half of 2023 materialized as spot Bitcoin funds began trading yesterday.
Following the realization of spot Bitcoin ETF expectations—a crucial catalyst for the recovery in 2023—Bitcoin experienced notable bullish moves.
While it didn't achieve the anticipated surge, the jump from the $44,000 limit to $47,000 at the beginning of the week was significant, breaking the consolidation phase since December.
Subsequently, upward momentum persisted towards $49,000, with sellers maintaining strength in this region. Despite this, BTC's daily close above $46,000 throughout the week signals persistent demand for the cryptocurrency.

Today's trade could be influential for the direction of Bitcoin in the coming days. The first reports on net flows will be seen for spot Bitcoin ETF products that had a good start with high trading volume yesterday.
The high demand for Bitcoin in the ETF market will continue to be positive for the cryptocurrency price. Apart from this development, global economic data can also be considered as a pressure factor for Bitcoin as it directly affects risky markets.
Although the US inflation numbers, which were higher than expected yesterday, created a situation that led the Fed to keep interest rates higher for longer, the contrary view still dominates the market.
However, breaking this resistance depending on Fed statements in the coming days may negatively affect the risk appetite and this may also be negative for Bitcoin.
On the other hand, after the slowdown in ETF-related activity, market participants will gradually start to focus on the Bitcoin halving event that will take place in April.
Although the effect of the prize halving, which has an effect that will reduce the supply of Bitcoin, will be felt in the medium and long term, it is possible to see various speculative movements as a pre-halving period until April.
Charts Reveal $50k Could Be Likely
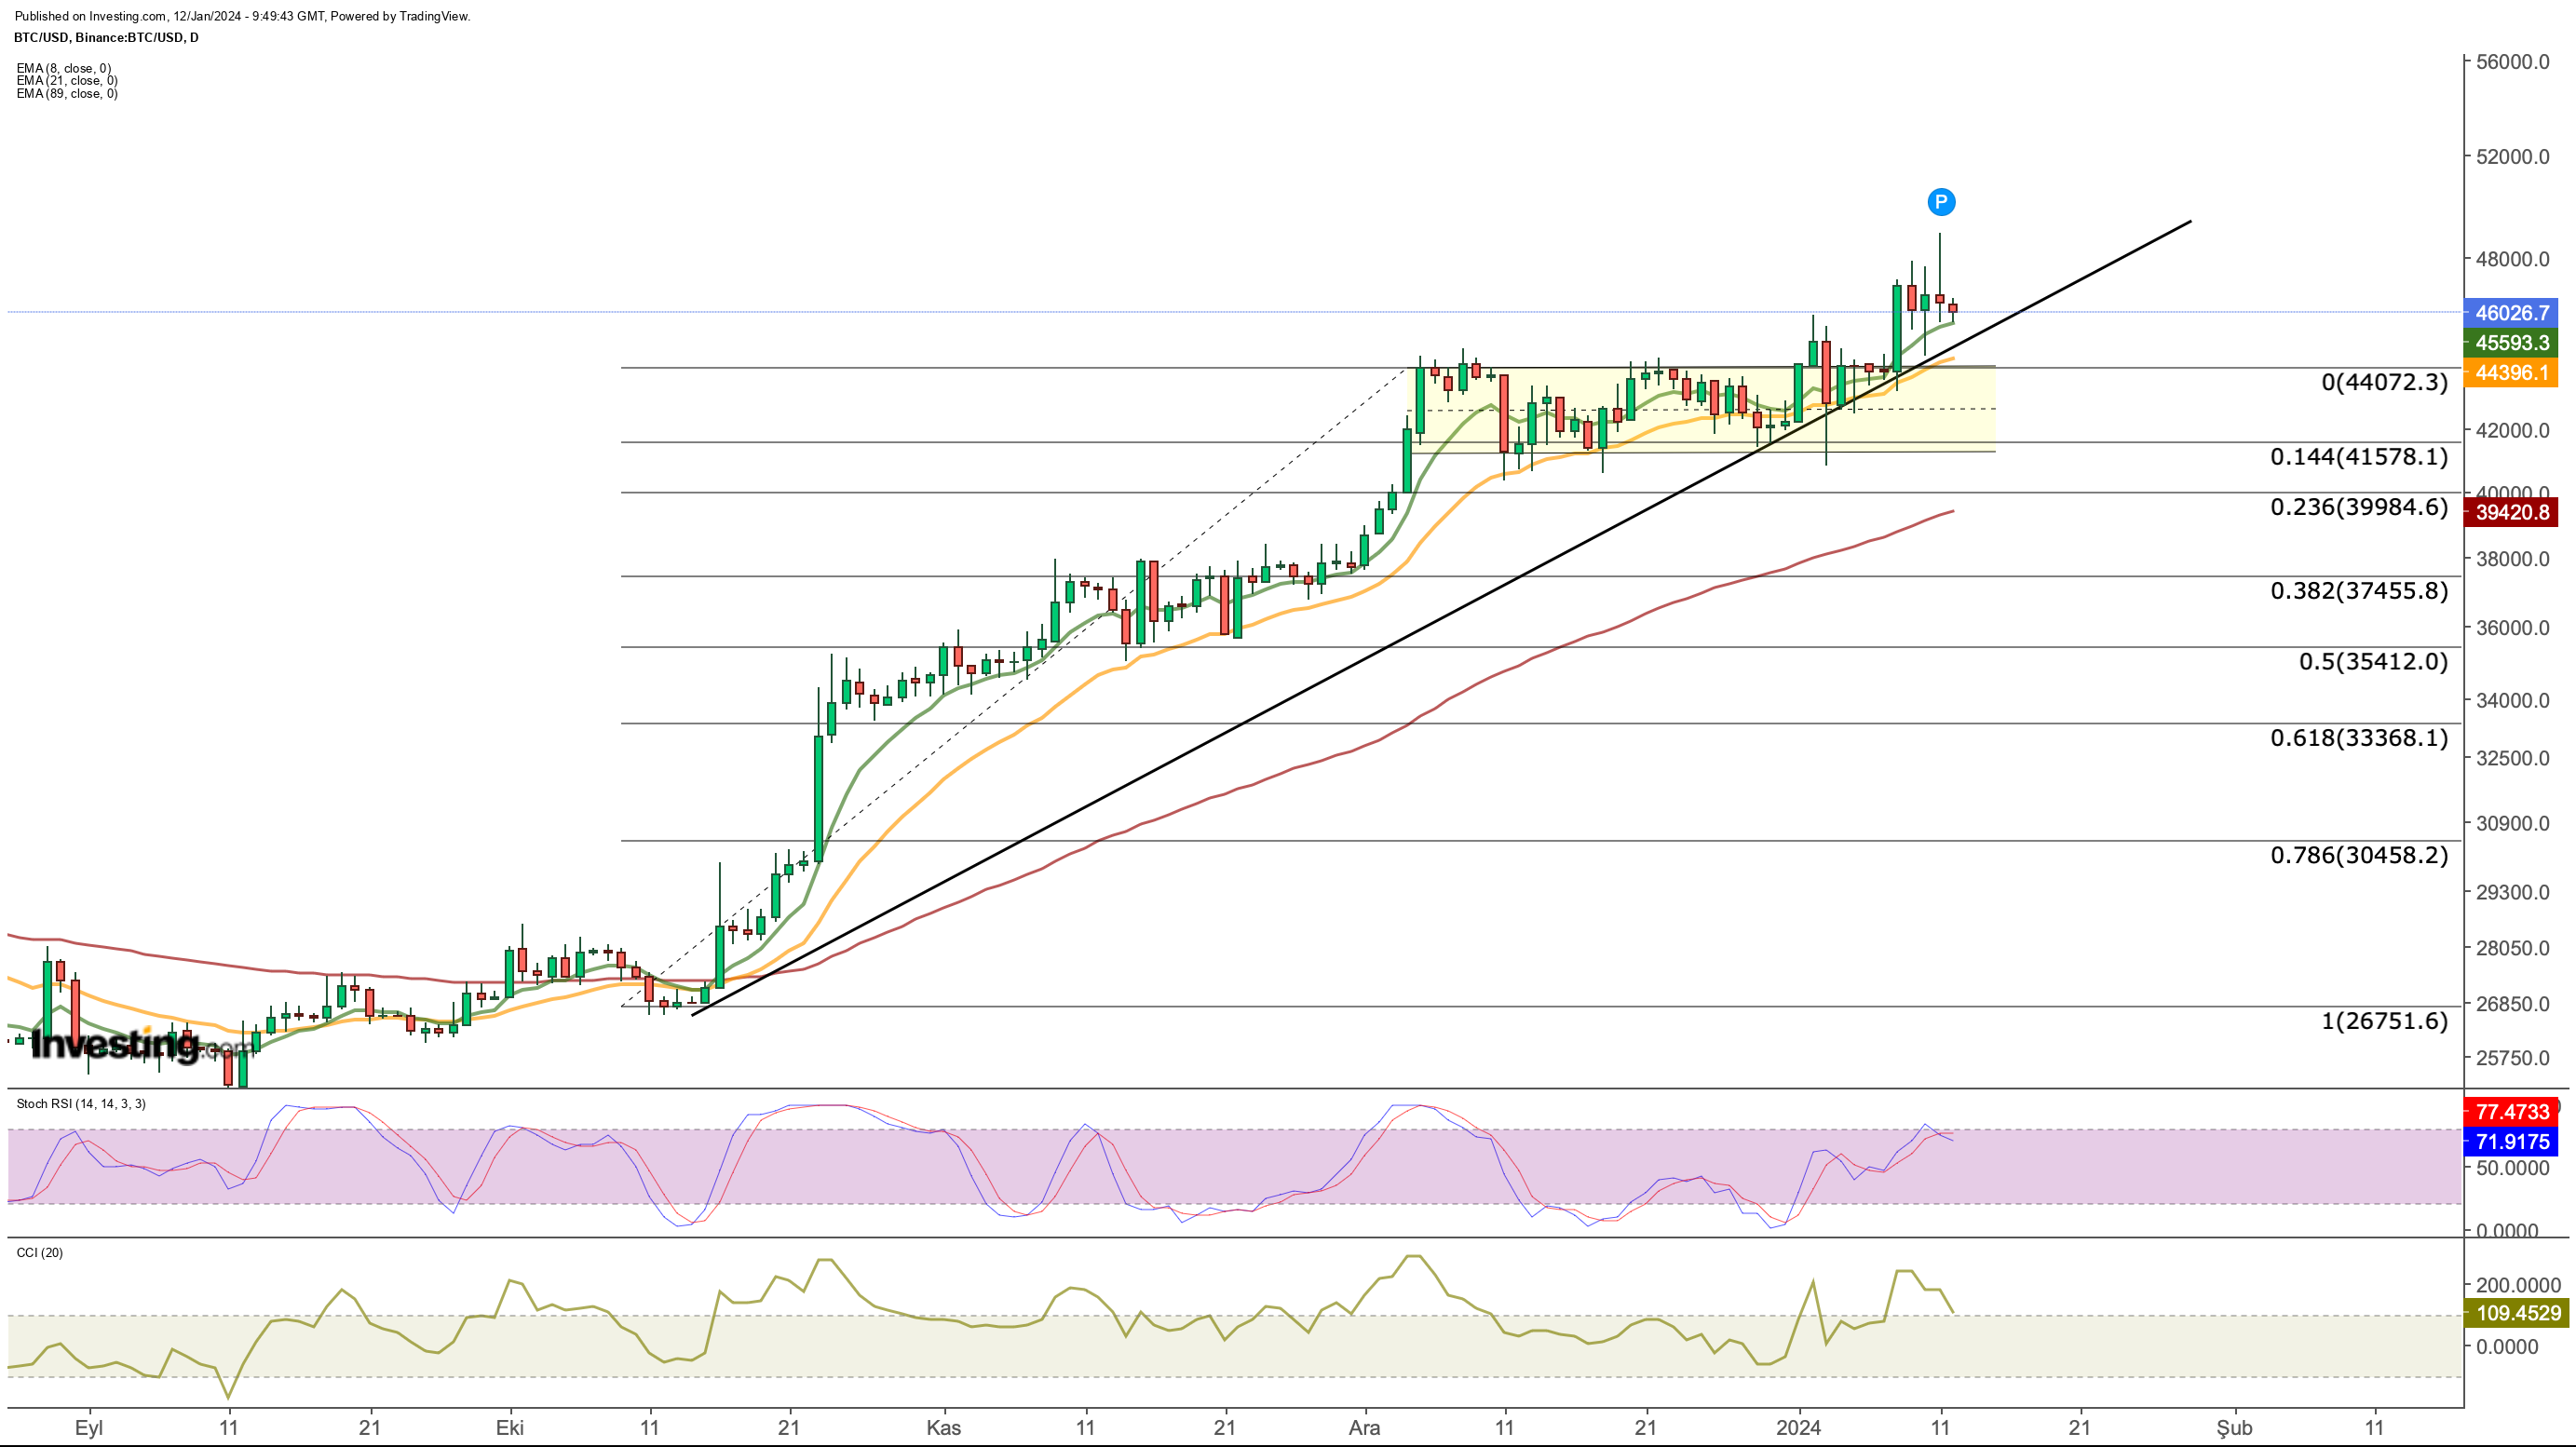
Technically speaking, Bitcoin, which started the year with an uptrend, broke its short-term horizontal outlook and made its first move toward the $ 48,900 resistance that we follow in the long-term outlook.

Despite the hard sell-off following this move, BTC has maintained its positive outlook by staying above $45,500 so far.
Nevertheless, Bitcoin's rapid pullbacks to the $44,000 limit and maintaining this price level may be favorable for strengthening upward moves.
However, day closes below $44,000 could be a negative in the short term as it would mean the cryptocurrency could be retreating into the consolidation zone.
If the $ 44,000 support breaks in a downward acceleration, the $ 41,000 area, which has been protected throughout December, will be followed as a second support line.
Bitcoin's daily closes above the ascending trend line originating in October may ensure the continuation of upward attacks.
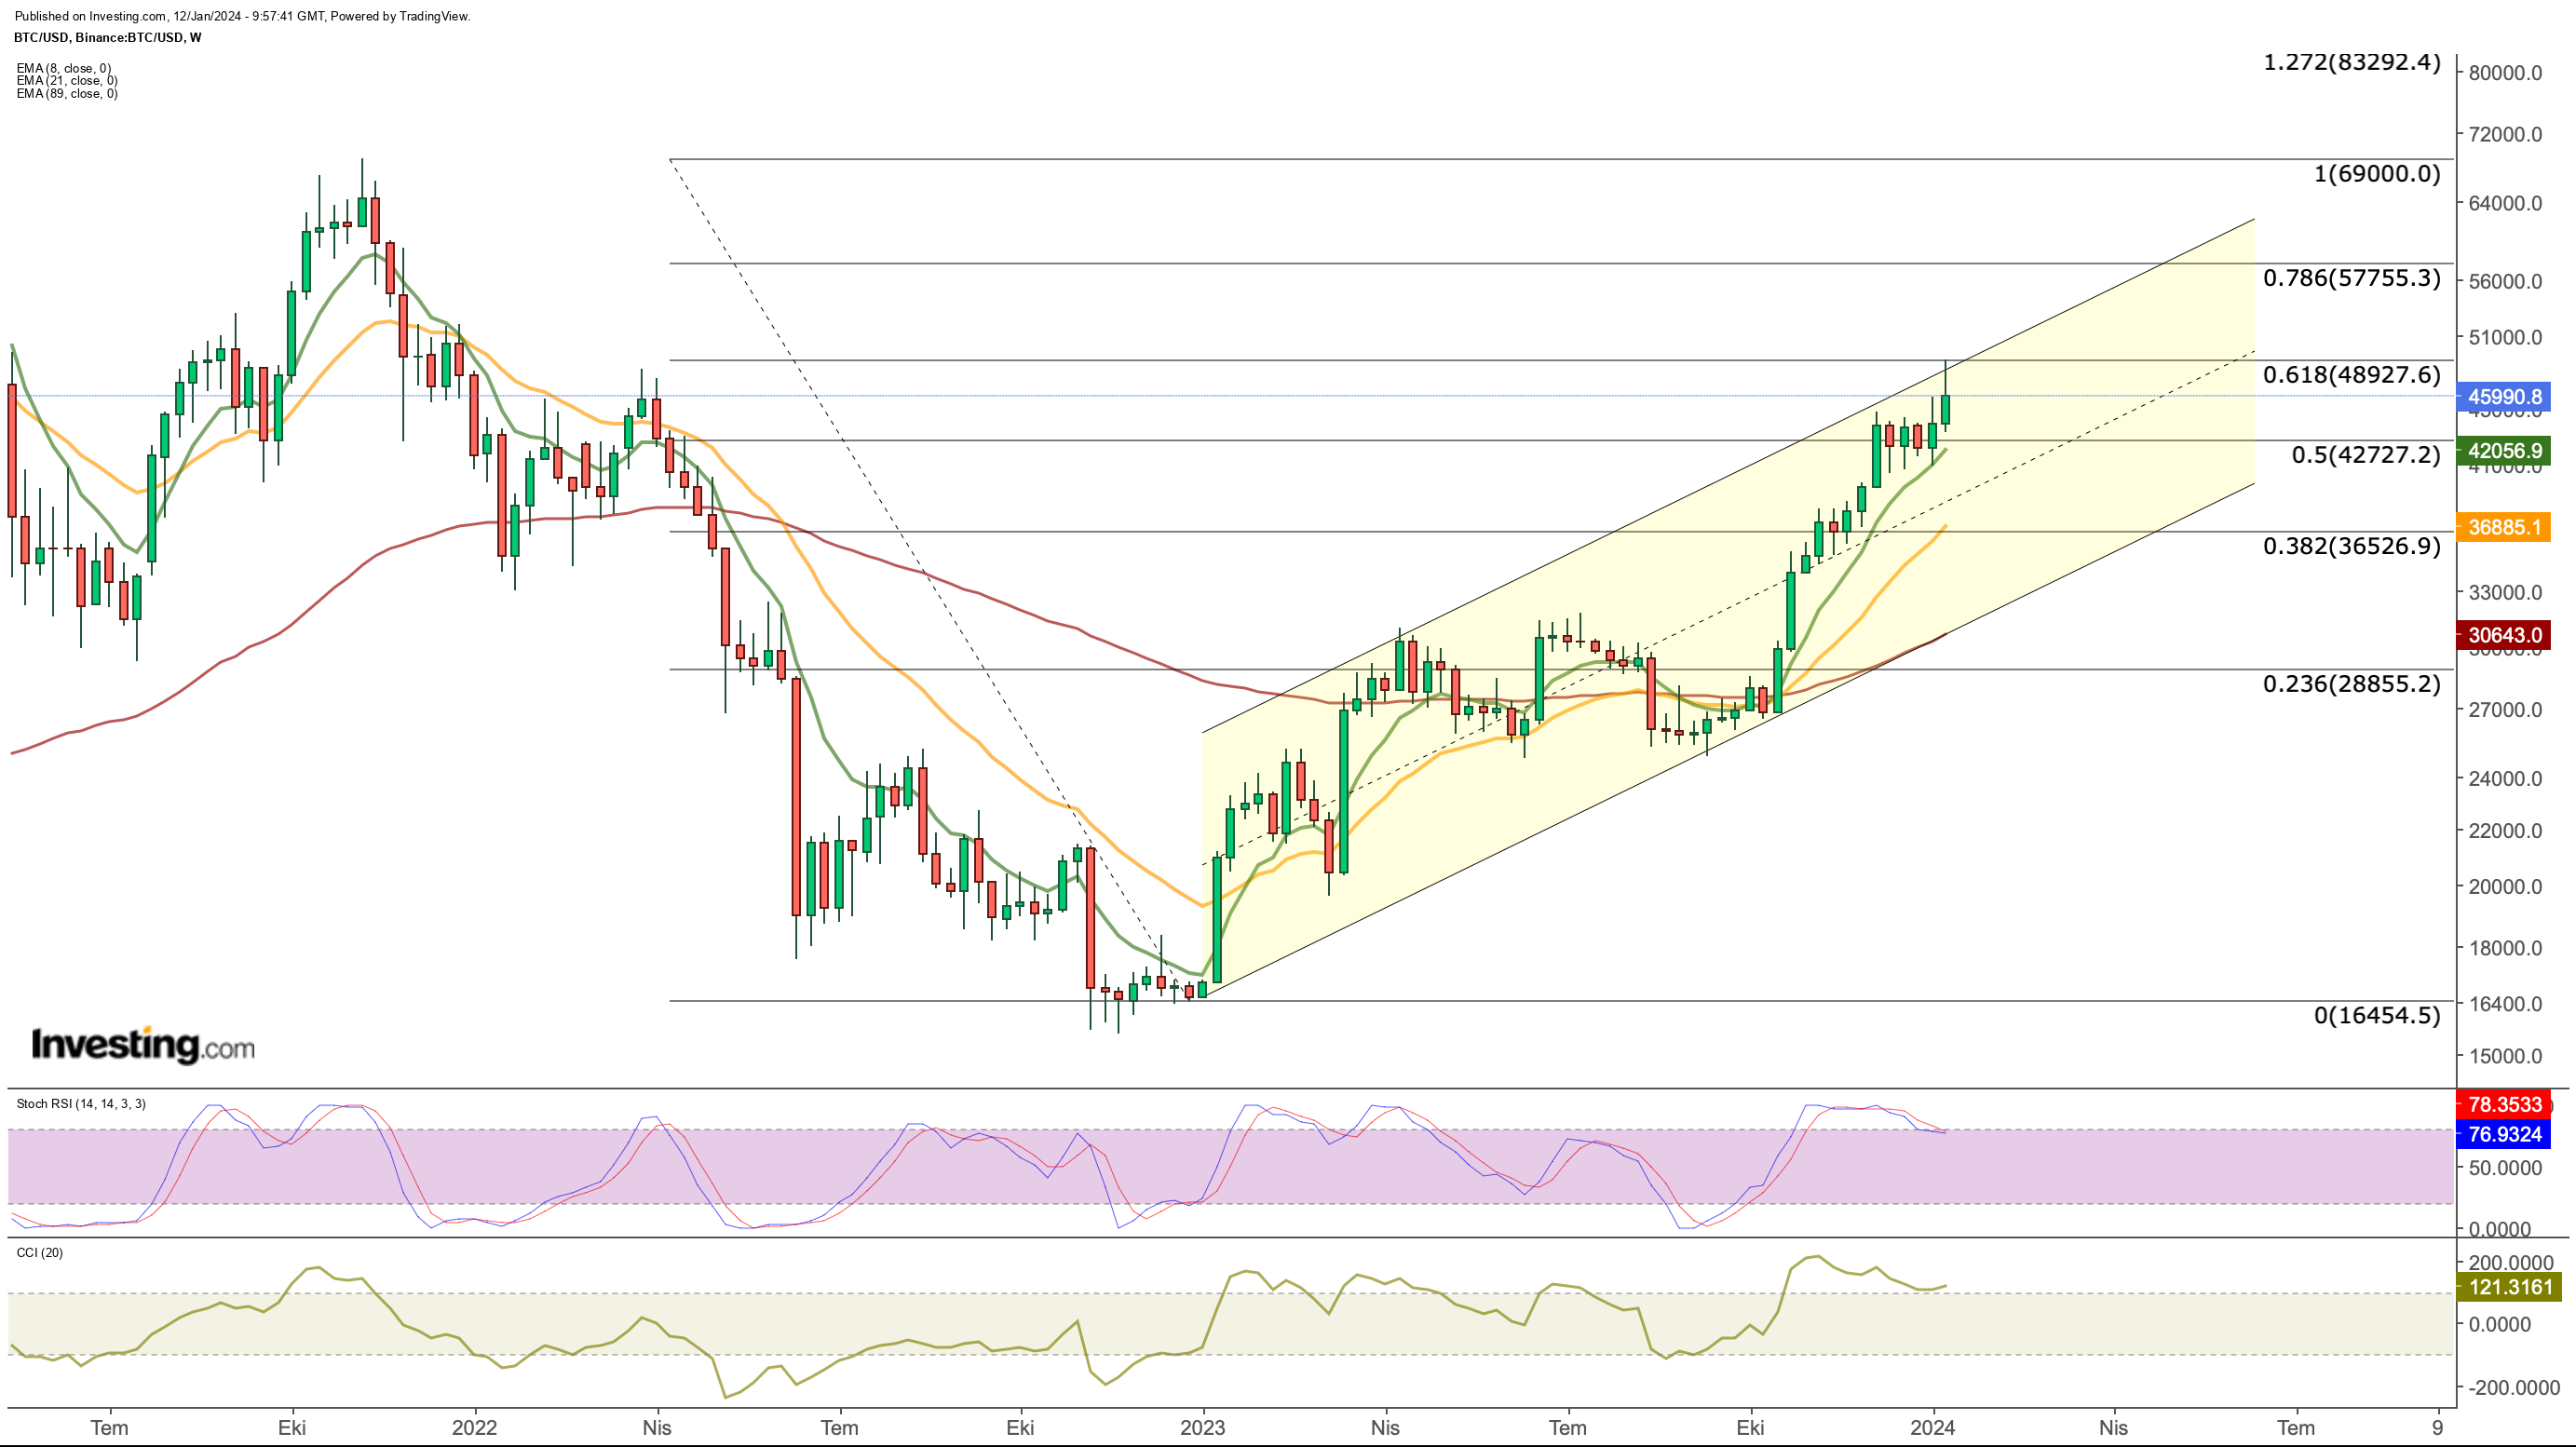
If we take a look at the possible upside targets with the help of the weekly chart; First, the Fib 0.618 value at $ 48,900 comes first.
This level was weakly tested this week. If a new wave of buying occurs, we may see that this price level, which is seen as the last obstacle for the $ 50,000 region, may break.
With a floor at $ 49,000 in the coming days, the next target seems to be at $ 57,000 according to Fibonacci levels.
On the other hand, unless the resistance at $48,900 is not overcome, selling pressure will begin to make itself felt.
A rebound from the upper band of the rising channel is likely to be met in the $41,000 area in line with the daily chart according to current market conditions.
Also, the appearance of the Stochastic RSI, which has been overbought since October on the weekly chart, suggests that a possible correction is not unlikely.
Conclusion
To summarize, daily closes below $44,000 will increase the likelihood of a correction, and a pullback to $41,000 in a possible correction could be considered a buying opportunity by investors.
If this possibility materializes, we could see BTC move up more strongly. As long as the cryptocurrency stays above $44,000, a new setup in the $50,000 region may occur in the coming days, depending on the breakout of the $48,900 resistance.
***
In 2024, let hard decisions become easy with our AI-powered stock-picking tool.
Have you ever found yourself faced with the question: which stock should I buy next?
Luckily, this feeling is long gone for ProPicks users. Using state-of-the-art AI technology, ProPicks provides six market-beating stock-picking strategies, including the flagship "Tech Titans," which outperformed the market by 670% over the last decade.
________________________________________________________
Want to start using InvestingPro? Here is a small gift from us! Enjoy an extra 10% discount on the 1 or 2 year plans. Hurry up not to miss the New Year’s sale! You can save almost 60%!
Follow this link for the 1-year plan with your personal discount,
or click here for the full 2-year plan with 60% off!
Disclaimer: This article is written for informational purposes only; it does not constitute a solicitation, offer, advice, counseling or recommendation to invest as such it is not intended to incentivize the purchase of assets in any way. As a reminder, any type of asset is evaluated from multiple perspectives and is highly risky, and therefore, any investment decision and the associated risk remains with the investor.
