- Bitcoin declined earlier in the week but eventually staged a recovery.
- This recovery reflects the optimism building ahead of Trump's appearance at the Bitcoin conference.
- The crypto will look to get as close as possible to the all-time highs.
- Unlock AI-powered Stock Picks for Under $8/Month: Summer Sale Starts Now!
Bitcoin experienced a volatile week, initially dipping to support levels before staging a strong recovery. The cryptocurrency bounced back from a low of $63,450 to reach a high of $67,000, representing a 5% move.
The upcoming Bitcoin Conference, featuring a speech by Donald Trump, has contributed to the recent upward momentum. The market has a history of pricing in positive developments related to the former US president.
However, it's essential to remember that Trump's election and subsequent policies are still uncertain, and the market's reaction could be exaggerated.
Meanwhile, Mt. Gox's ongoing process of returning Bitcoin and Bitcoin Cash to creditors has proceeded smoothly, alleviating concerns within the crypto community.
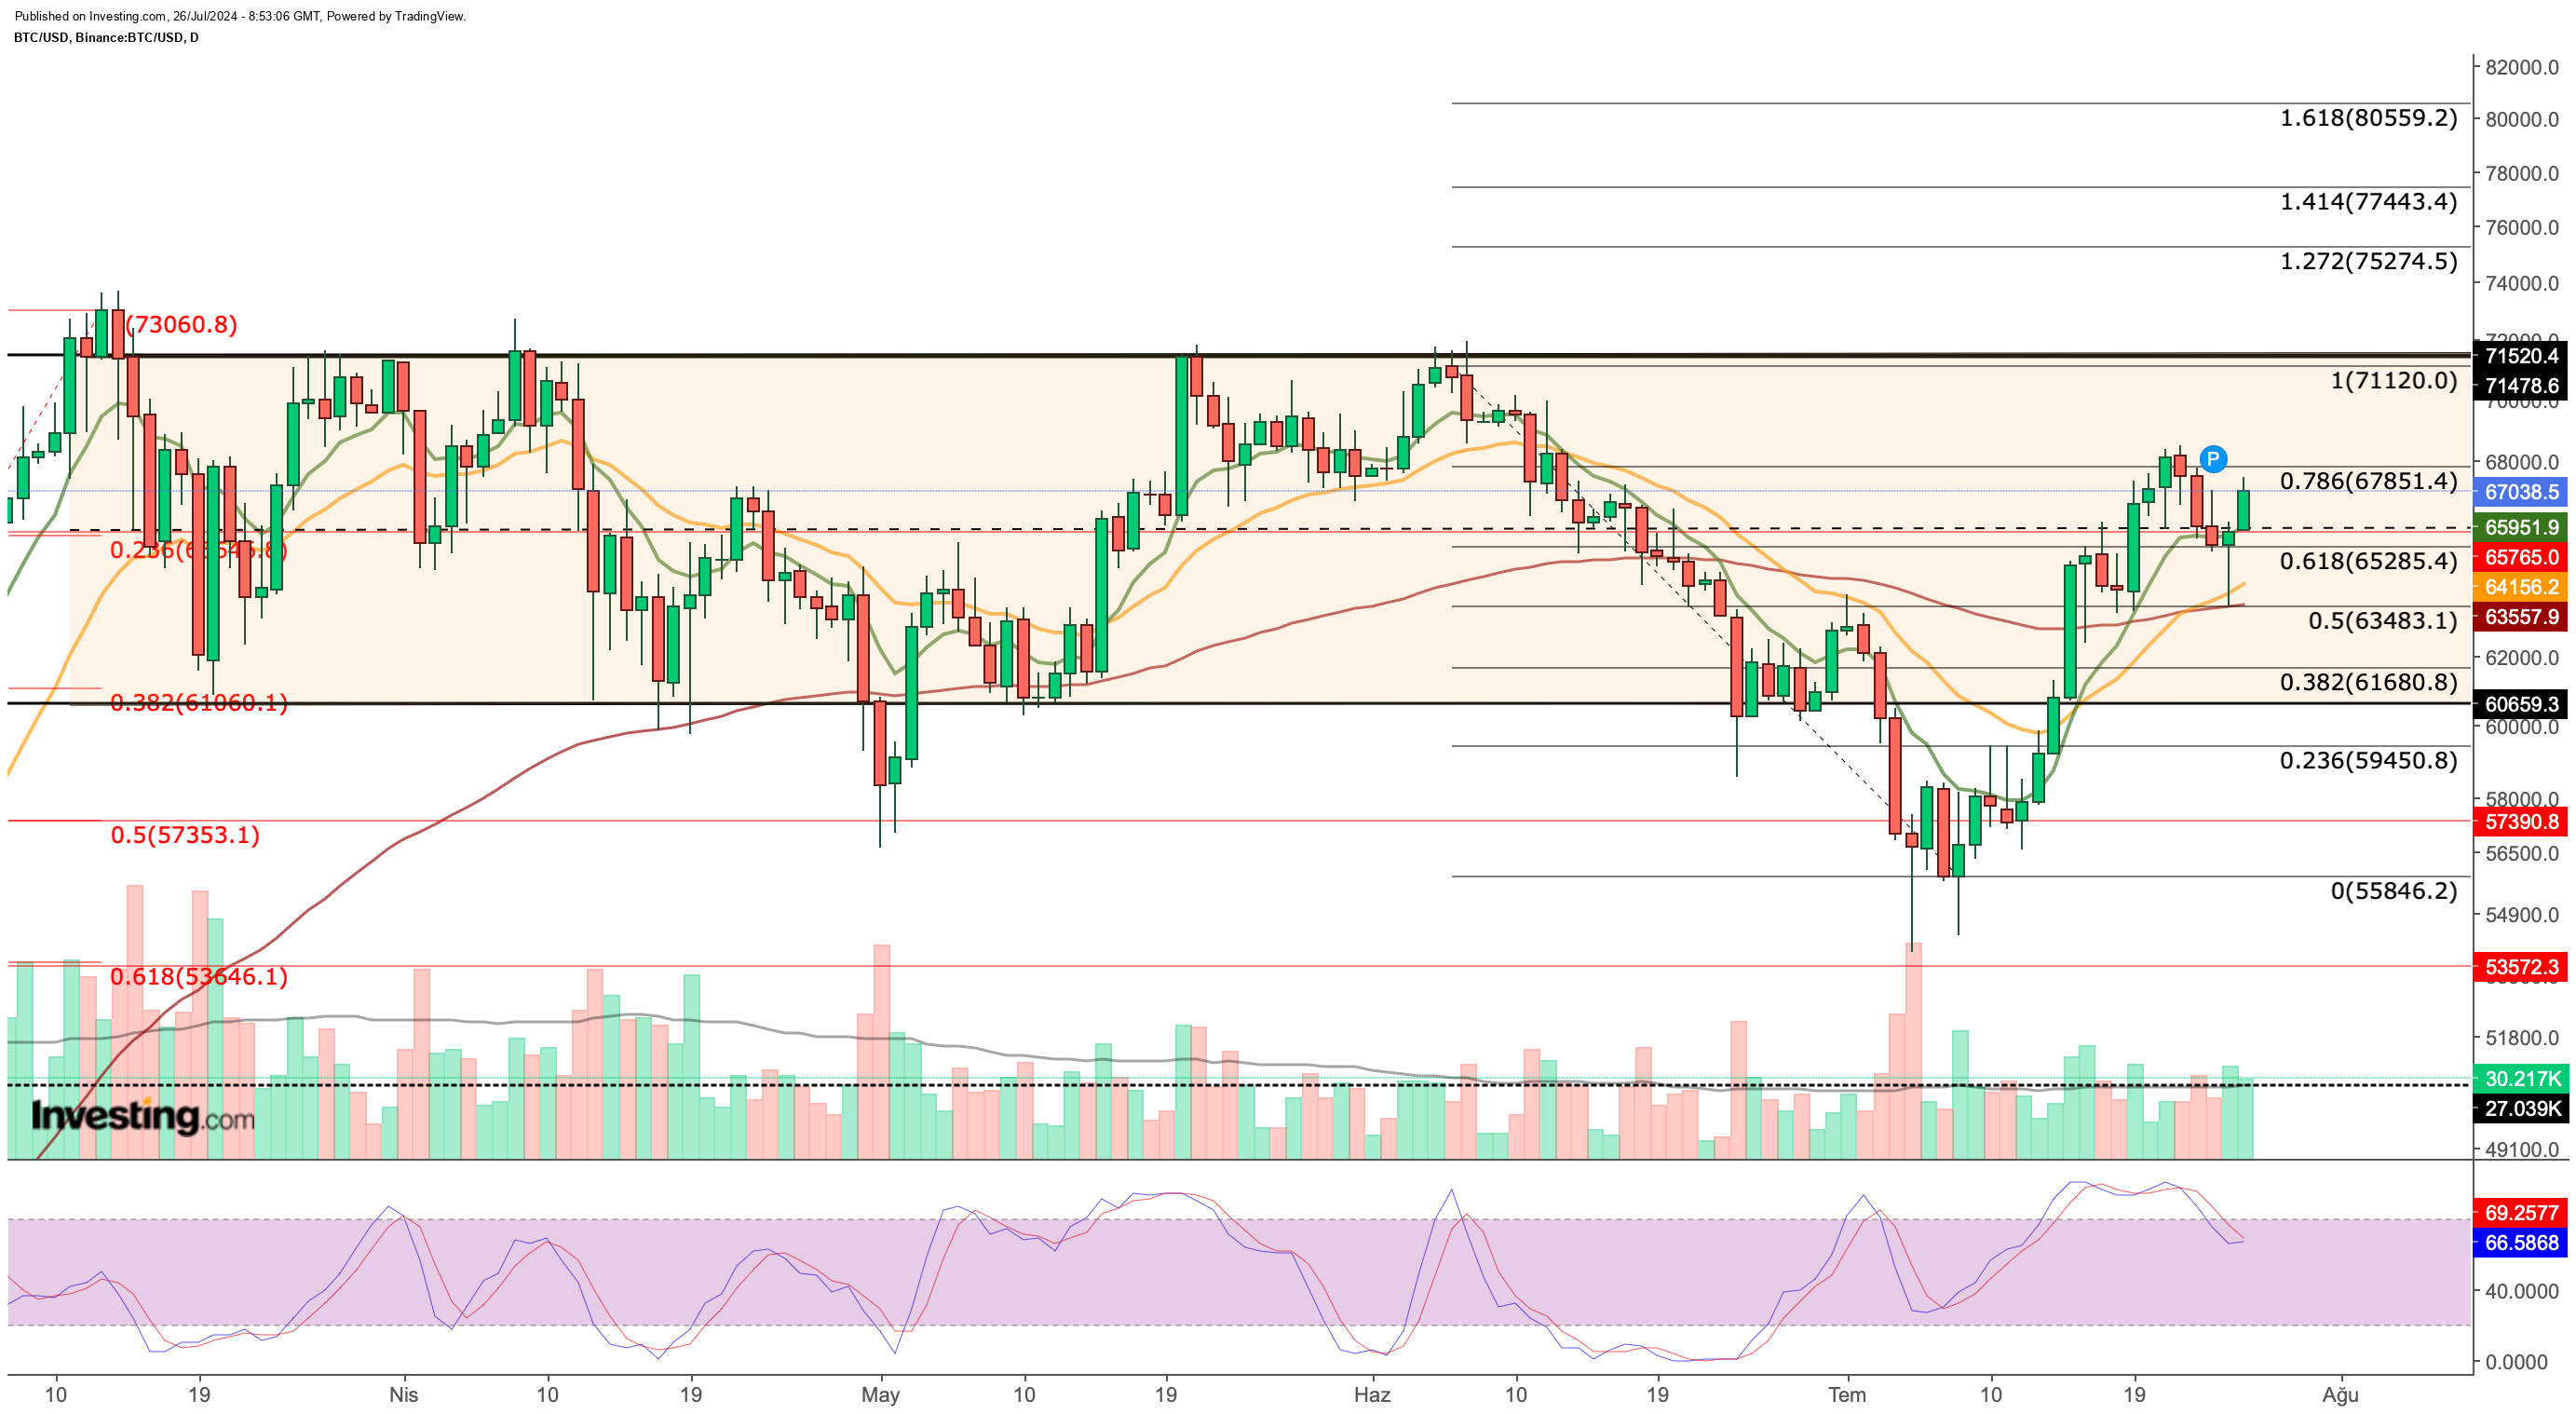
Technically, Bitcoin has reclaimed the crucial $65,000 level, suggesting a potential continuation of the uptrend. This area now serves as a key support level, with resistance located around $67,000.
The recent price action has formed a bullish needle candlestick pattern, reinforcing the potential for further gains.
However, the broader market's risk-off sentiment has dampened Bitcoin's momentum, creating increased volatility. Traders should closely monitor price action and technical indicators for clues about the next directional move.
Bitcoin Price Action Analysis
Over the past week, Bitcoin has established $65,000 as a key support area. A secondary support level has formed around $63,500, aligning with short-term EMA values. Maintaining a price above $65,000 is crucial for Bitcoin to attract new buyers and sustain its uptrend.

On the upside, Bitcoin encountered intermediate resistance at $68,000 this week, corresponding to the Fib 0.786 level from the June retracement.
Key levels to watch are $65,300 and $67,850, which will influence the trend's direction. If Bitcoin closes the week around $68,000, it could aim for a new record high next week.
Should Bitcoin break its previous record level, the short-term target price zone remains between $75,000 and $80,000.
Weekly Bitcoin Chart Analysis
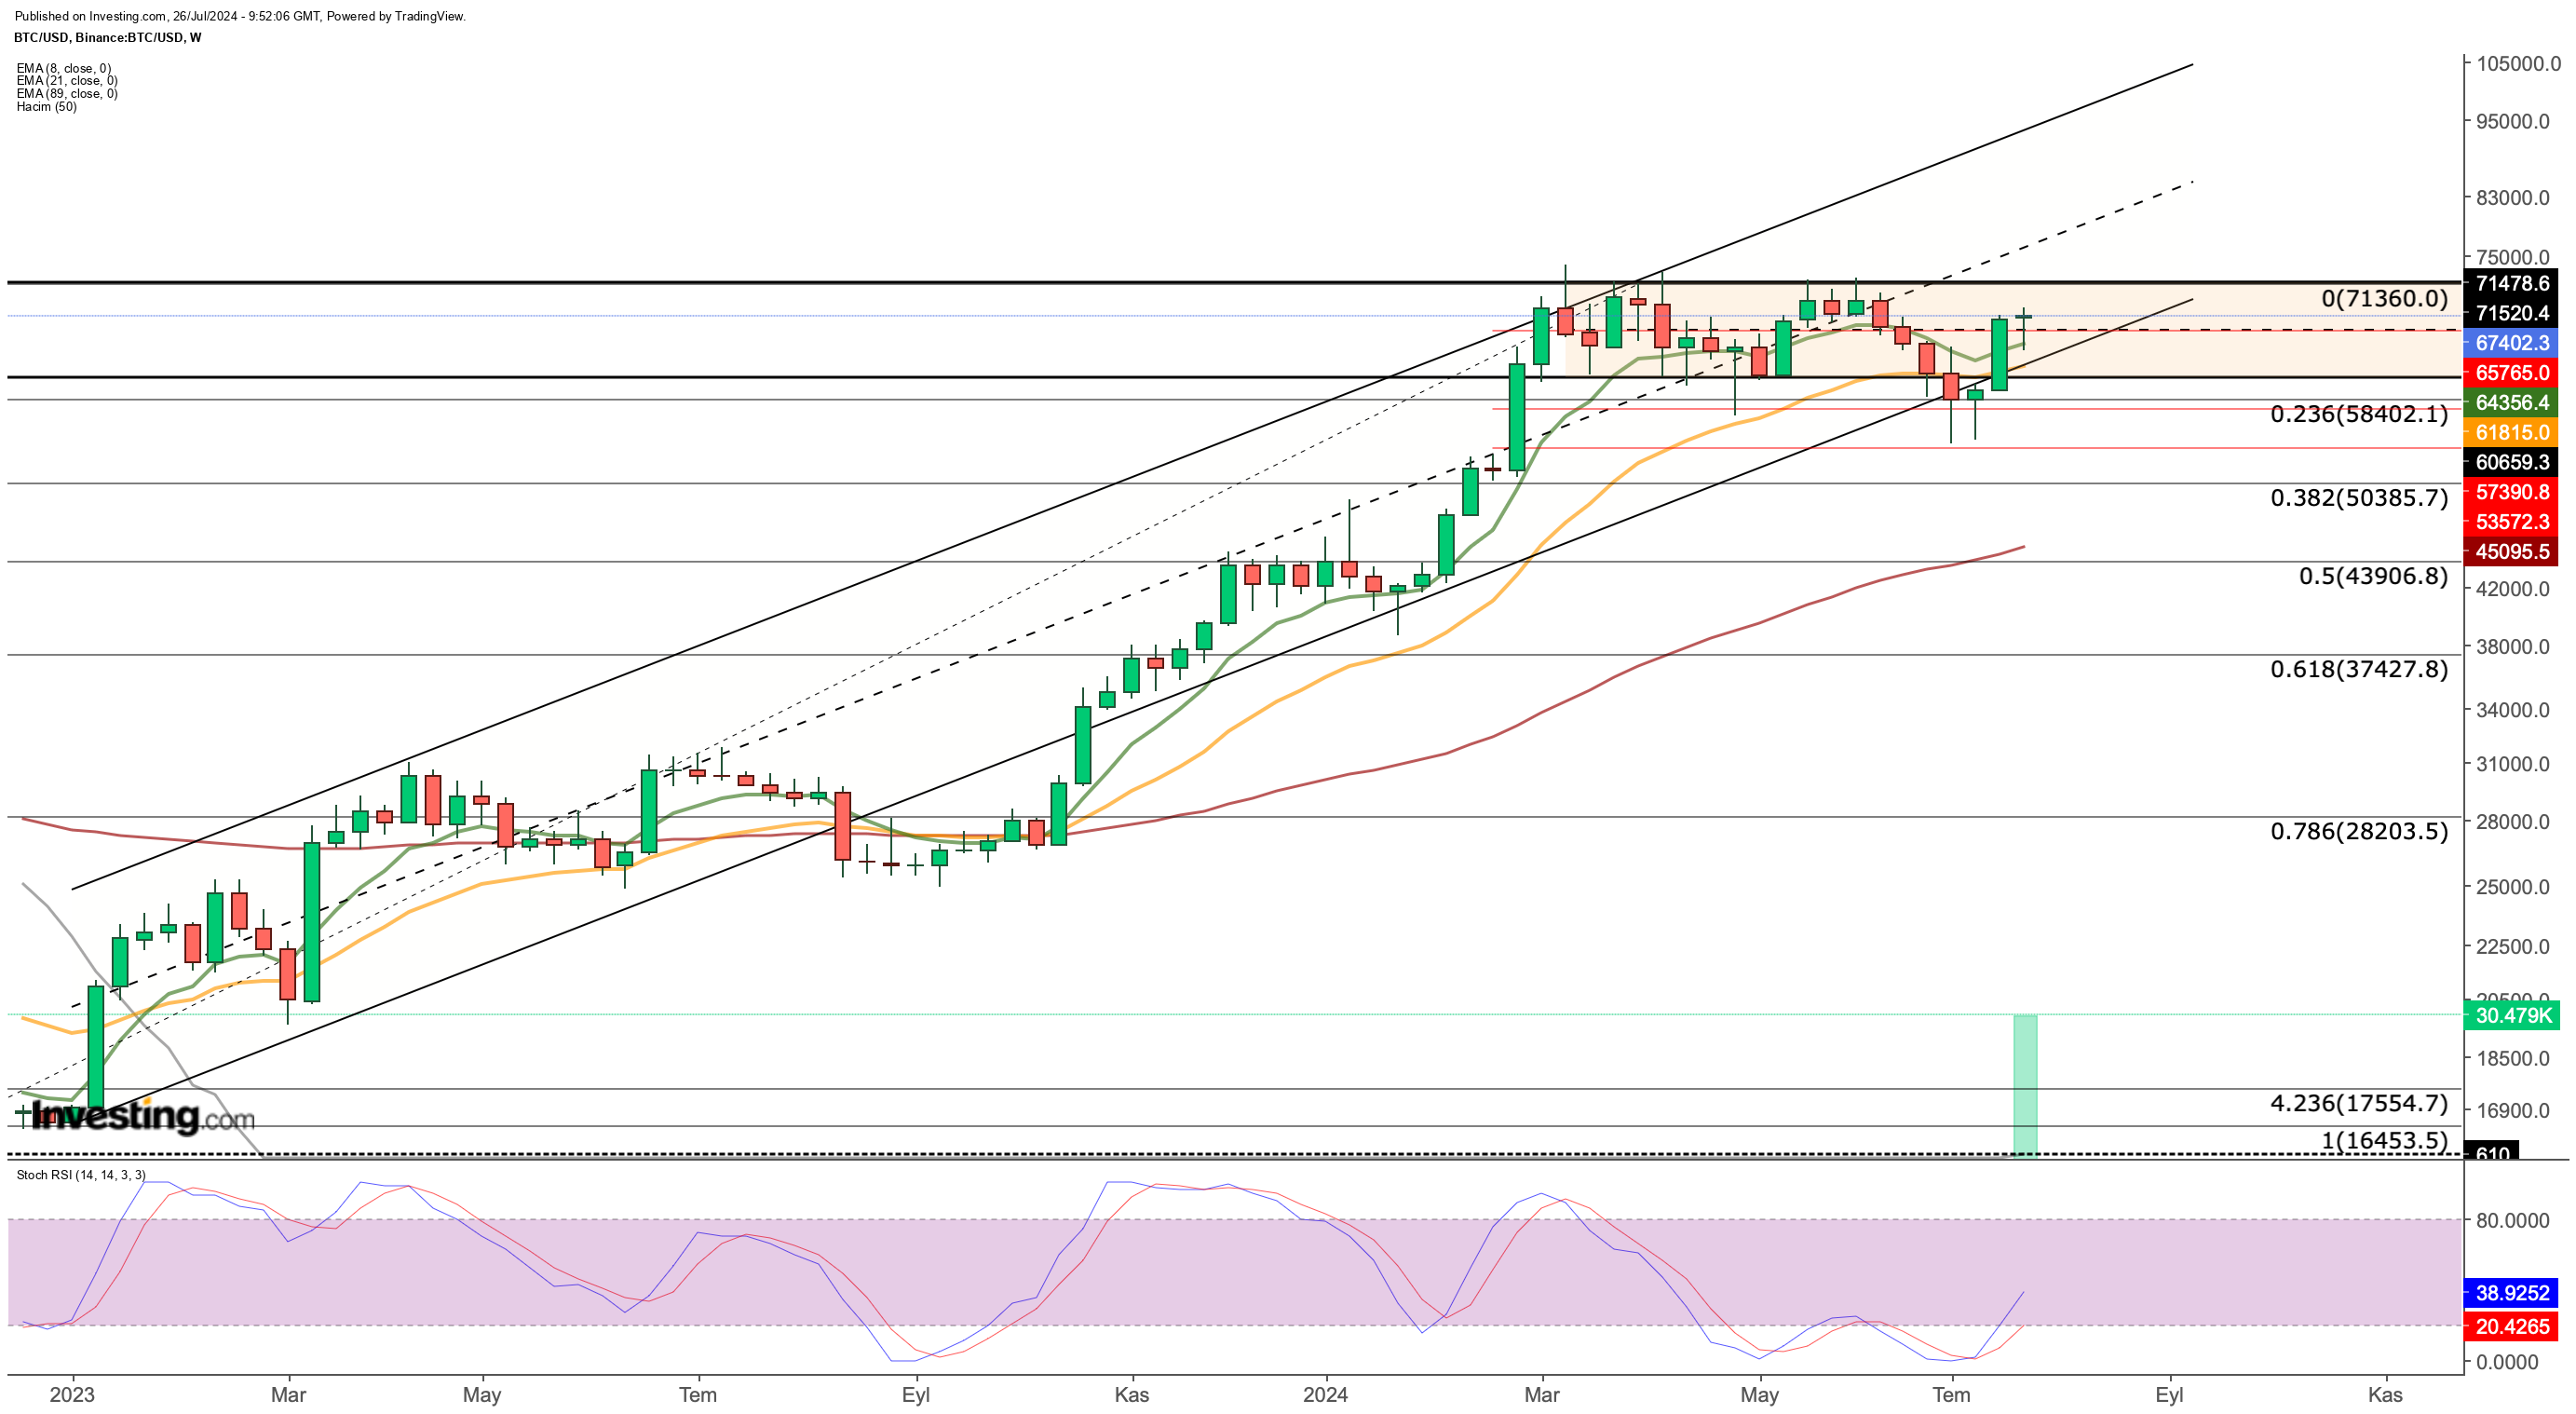
The weekly chart shows a positive signal with the Stochastic RSI turning upward, reflecting last week's bullish momentum.
However, Bitcoin's failure to close the week at $70,000 previously invalidated this bullish signal. Currently, a weekly close above $65,000 would reinforce the bullish outlook.

A close above this level could trigger a move towards the middle band of the ascending channel, targeting the $75,000-80,000 range on the daily chart.
Additionally, the medium-term exponential moving averages on the weekly chart support the positive trend, as Bitcoin remains above these values. However, a daily close below the $65,000 support could disrupt this positive outlook.
***
This summer, get exclusive discounts on our subscriptions, including annual plans for less than $8 a month!
Tired of watching the big players rake in profits while you're left on the sidelines?
InvestingPro's revolutionary AI tool, ProPicks, puts the power of Wall Street's secret weapon - AI-powered stock selection - at YOUR fingertips!
Don't miss this limited-time offer.
Subscribe to InvestingPro today and take your investing game to the next level!
Disclaimer: This article is written for informational purposes only; it does not constitute a solicitation, offer, advice, counsel or recommendation to invest as such it is not intended to incentivize the purchase of assets in any way. I would like to remind you that any type of asset, is evaluated from multiple perspectives and is highly risky and therefore, any investment decision and the associated risk remains with the investor.

