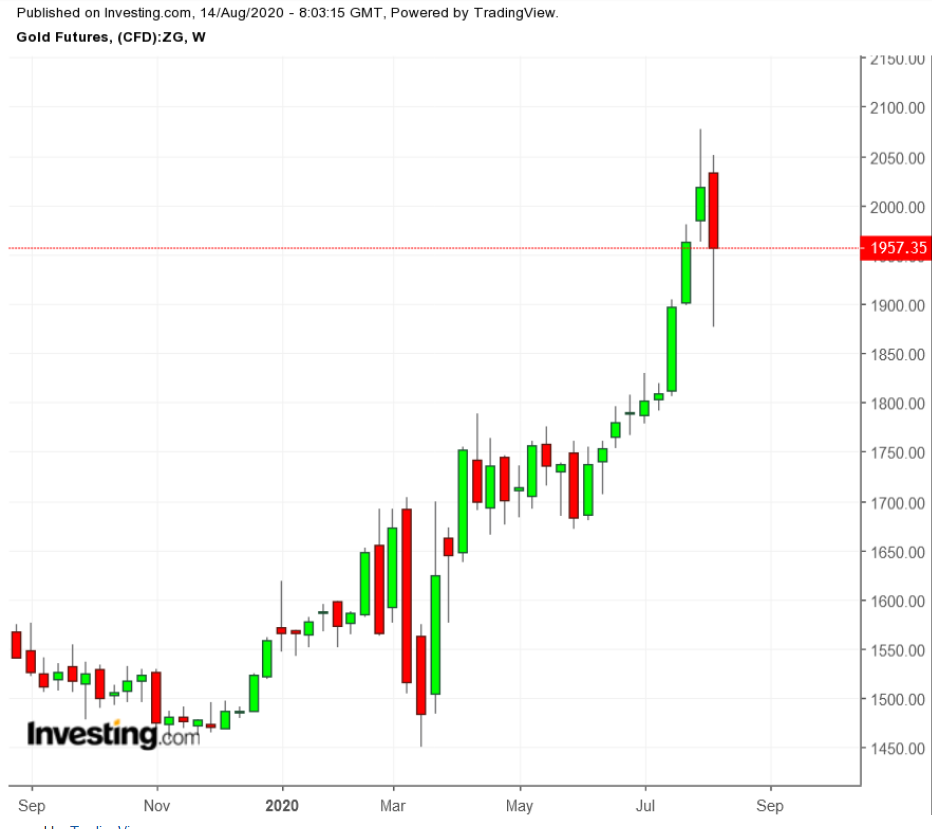
From a market that could go only one way—up—gold has become one that isn’t going anywhere.
Since the worst one-day carnage in seven years—where the most-active gold contract on New York’s Comex lost $93 and swung an even greater $129 between the highs and lows of the day—trading in the yellow metal has turned into a game of pure nerves. Or, at best, high-powered chess.

A week ago, gold was taking out one high after another in the hitherto unseen $2,000 an ounce territory, reaching just $11 short of bulls’ desired short-term utopia: $2,100.
Game Of Chicken
Having gone to $1,800 levels since and rebounding to the low $1,900s, gold’s now turned into a game of chicken, with the question being who’ll blink first: the longs or the shorts? From a more complex pricing perspective, gold charts offer mind-blowing possibilities: a return to near pre-crash levels of almost $2,040 or a renewed plunge to $1,700. Bull or bear, you pick your poison or the drummer you wish to march to.
“The curious case with gold is what, when and how much surprise it comes with,” said Sunil Kumar Dixit, an independent precious metals chartist.
“For now, there’s no longer one-sided momentum. Volatitity is on either side.”
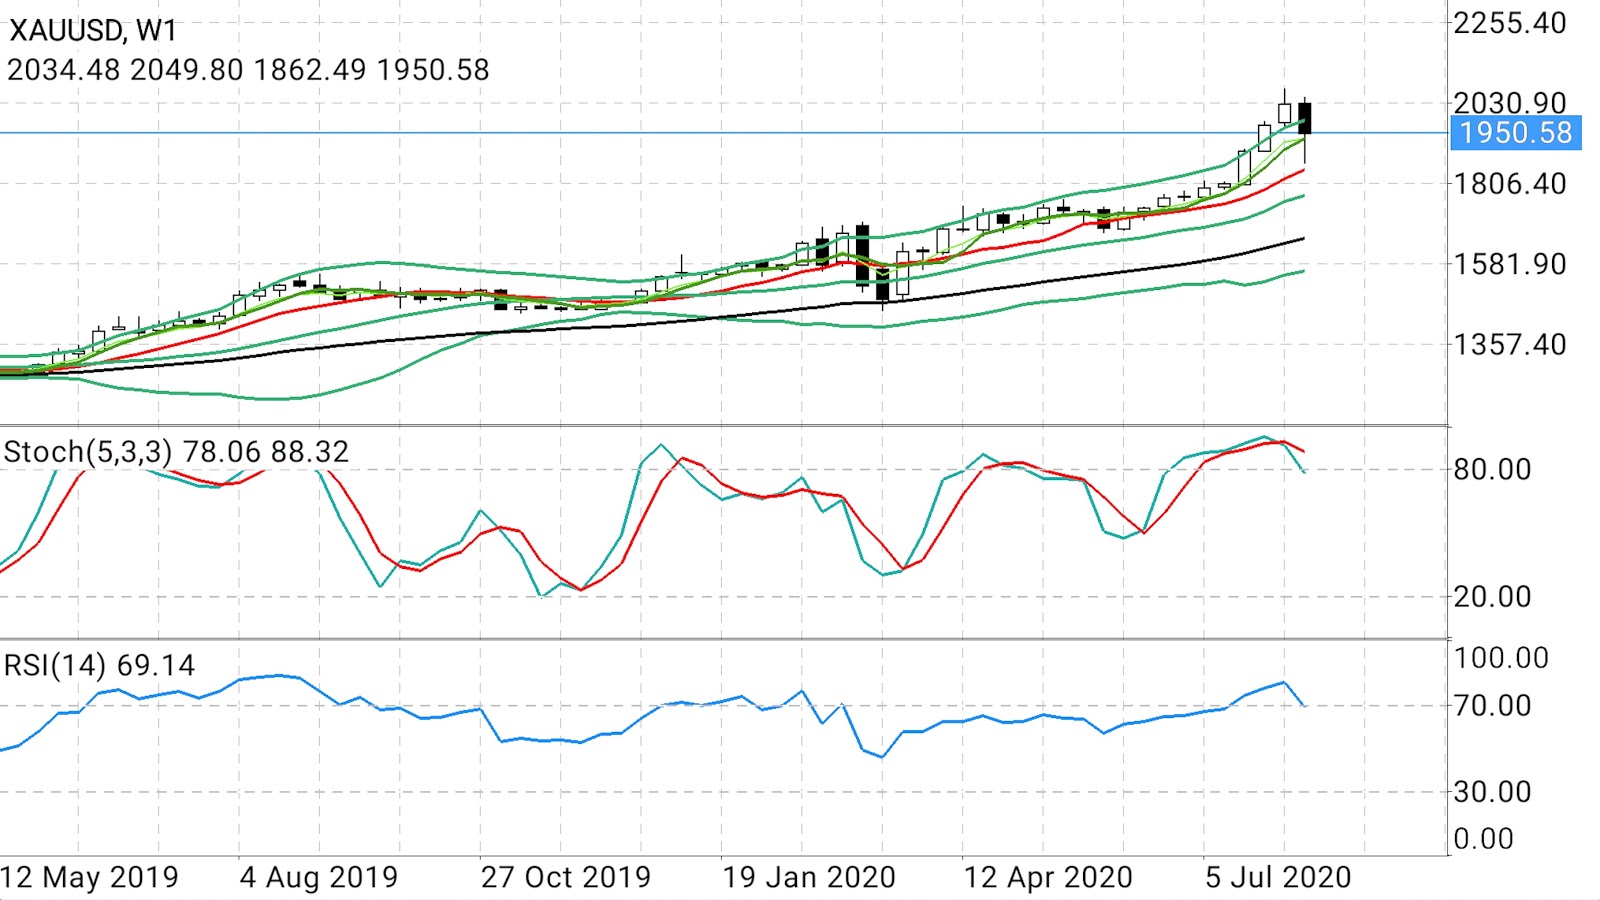
Gold’s stochastic chart in a weekly time frame.

Chart courtesy Sunil Kumar Dixit
Dixit said the “upper flanks” of gold showed a market that could go from $1990 to $2,007 and $2,015, while “lower linings” could bring a range from $1,920 to $1,900, $1,888 and $1,860.
“A range break on either side can add momentum of $40 to $100 more,” he added. His best bullish case for gold is a ramp up to between $2,015-$2,029.
“I don't see the bulls succeeding above $2,029 to $2,039 as it this will be a point of huge breakdown,” Dixit said.
The $2,039 level brings gold just below this week’s intraday peak of $2,040.50 managed by the most-active December futures contract when it rebounded from the depths of its sell-off at $1,911.30.
“Somewhere at some point, between $2,015 to $2,029, or $2,039 at the extreme, a secondary top is going to be formed,” Dixit added.
Should that level be reached or breached, a new nightmare may start for gold bulls, he warned. “If this happens, expect a second wave of sell-off which may eventually see gold correcting to somewhere between $1,770 and $1,750.”
Gold Needs 3-Days Of Positive Close
He said only a three-day back-to-back positive close and a weekly settlement at $2,029-$2,039 will likely reverse the downside momentum to make gold return to its main bullish trend.
Jeffrey Halley, Sydney-based analyst for New York’s online trading platform OANDA, had similar observations, with some notable exceptions.
“Both gold and silver … are still vulnerable to sharp dips at the first hint of trouble, be it negative headlines or substantial real money flows,” he said.
“The nature of the FOMO crowd is that the positioning is not sticky,” Halley said, referring to traders who got into a market due to the ‘Fear-Of-Missing-Out’ on a rally, only to abandon the attempt when the tide turned.
“(They) will head for the exit door at the first sign of trouble, especially after the emotional onslaught suffered on Tuesday.”
He added:
“Gold's next move is unclear at these levels, with the risks evenly balanced either way in the near-term. One thing is absolute, though, the remarkable volatility will continue, and investors will need deep pockets and a strong stomach.”
But Halley also observed that the fast money that rolled out of gold was just as quick to roll back in to establish new long positions. That essentially told him one thing: gold was still in a predominantly bullish channel.
This was particularly evident with the yellow metal’s 1% rebound on Thursday, despite a continued steepening of the US 10-Year Treasury yield curve. Spiking bond yields, along with a sudden turn-around in the US Dollar Index, were what triggered the gold avalanche this Tuesday.
Spikes In US Yields, Dollar Won’t Last
Halley thinks the yields spike is a fad that will fade soon on the impact of the Federal Reserve’s ultra-low US interest rates and new deficit spending by Congress in fighting coronavirus.
“The Federal Reserve remains an uber dove, and we can be 100% sure that they will nip any significant rises in long-term yields, or any yields for that matter, in the bud,” he said
The same could be said for the EUR/USD trade, which led the dollar sell-off the past two months, he said. The euro was at $1.1810 in Friday’s Asian afternoon trade and a breakthrough above $1.1920 would signal the next leg of the dollar sell-off, benefiting gold, he said.
Christopher Vecchio, a gold chartist who blogs at Daily FX, concursL
“The technical structure remains bullish as the uptrend from the March low remains intact, and the fundamental argument – that negative real yields will persist – has not been harmed,” said Vecchio.
Gold Bulls “Still In Control”
To make his case, he illustrates this point: thus far, the US Treasury 10-year yield was up by +11.4-bps, concurrent with gold price’s -4.4% loss. But back in the first week of June, when the US Treasury 10-year yield added +24.4-bps, gold fell by -2.6%. That there has been a deeper pullback in gold prices this week amid a more restrained rise in US Treasury yields relative to June suggests that the long gold trade was overcrowded.
“And so, with the worst daily performance since April 2013 this Tuesday, it may be the case that these weak hands—recent participants in the long gold trade, who were stopped out—have been shaken out of the market,” said Vecchio.
“Gold prices have stabilized after suffering their worst daily loss since April 2013. Are bulls still in control? For now, yes.”
