- Key market indicators are generating intriguing signals as January concludes.
- Going ahead, this election year could end on a positive note despite the mixed start to the year.
- In this piece, we will discuss 6 indicators investors need to monitor as 2024 unfolds.
- In 2024, invest like the big funds from the comfort of your home with our AI-powered ProPicks stock selection tool. Learn more here>>
- Netflix’s fair value is 552.31. Want to see more information about the companies you trade? Enjoy an extra 10% discount over the current discounts we have on our 1 or 2 year plans, saving up to 60%. Hurry up as the New Year’s offer end on 31/01/24!
- To claim your extra discount, use the codes UKTopDiscount and UKNewYear2 for yearly and bi-yearly plans respectively.
As January draws to a close, the market is exhibiting intriguing trends and signals that warrant careful consideration.
Historically, the first few months of an election year can generate mixed signals, evident in two key indexes: The S&P 500 continues to reach record highs, while the Russell 2000 remains stuck in a holding pattern.
Mega-caps are still leading the way, and commodities aren't getting much attention. The market's not too volatile right now, but that could change.
Keeping that in mind, here are seven market signals investors should watch closely to spot potential trend changes:
1. S&P 500 Keeps Making New Highs
The S&P 500, closed at all-time highs for the second consecutive week. Since touching the bottom three months ago on October 27, it has recorded a series of consecutive positive performances. 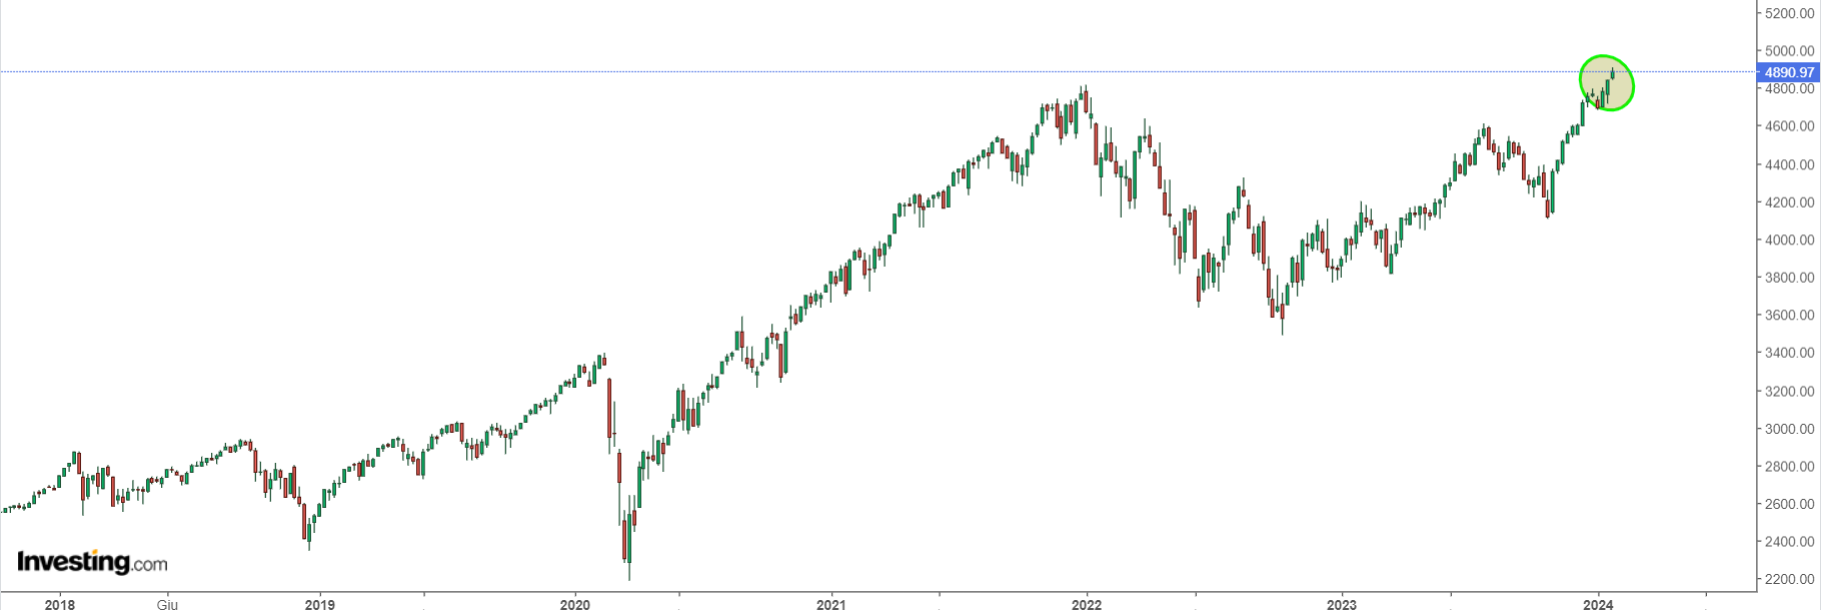
This included nine weeks of gains and the current three-week positive series that led to the new all-time high of 4890 points.
The rally represents a remarkable +18.7% gain, marking its best 13-week period since June 2020, the bottom of the Covid lows.
2. Russell 2000 Is Trapped in a Sideways Channel
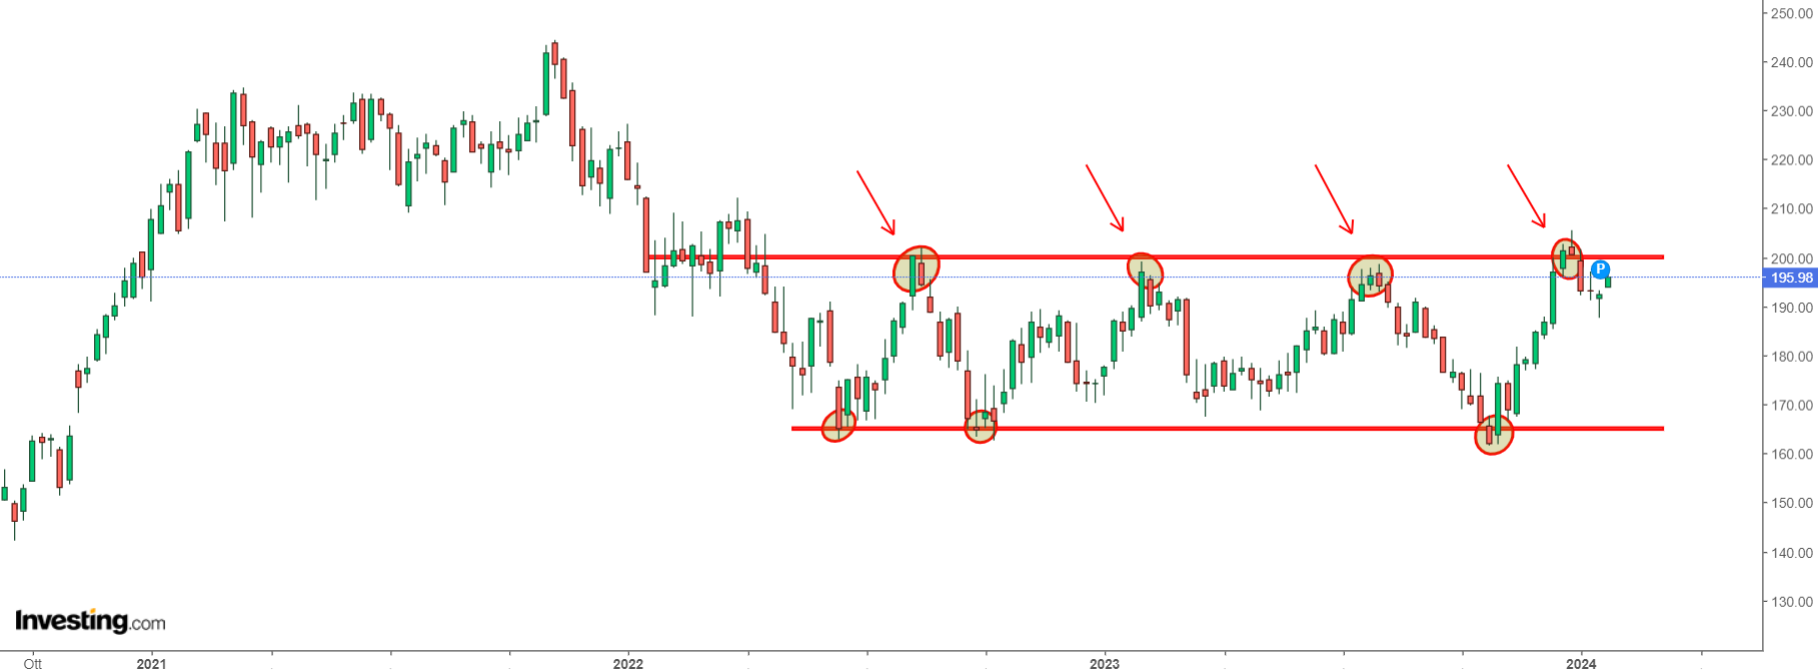
The Russell 2000 has traded in a sideways channel, which formed between the lows of June 2022 and the highs of August 2022.
This channel persists as a significant psychological barrier that currently appears difficult to overcome.
3. Initial Months of an Election Year Tend to Be Volatile
In the first-quarter of an election year, markets tend to be volatile.
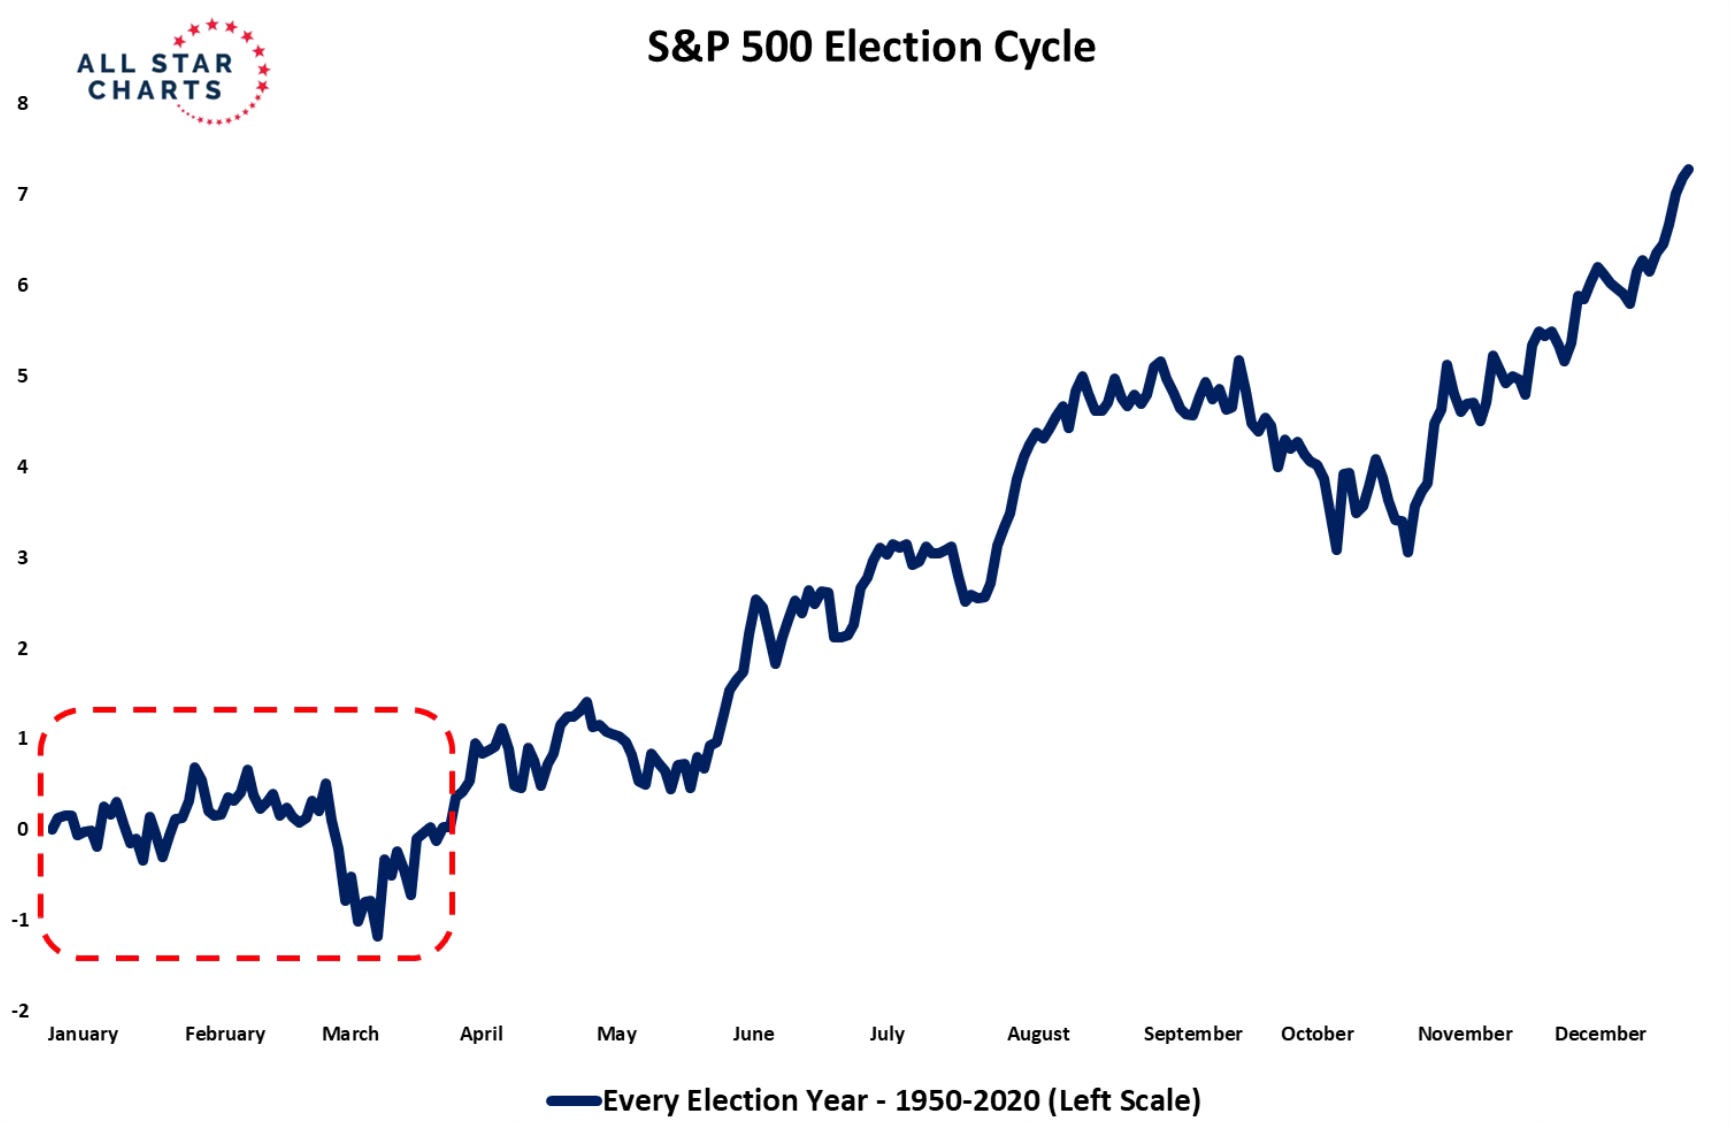
The S&P 500, in the period from 1950 to 2020, has generally exhibited positive annual performance during election years.
This historical trend could be viewed optimistically, suggesting a potentially positive outlook for 2024.
Despite the potential for a lateral or bearish trend in the initial three months, historical data indicate that the second half of the year might turn out to be much better.
4. Magnificient 7 Still Outperform the Broader Market
Over the past year, the NYSE FANG+ index has demonstrated remarkable performance, recording a +76% increase, surpassing both the Nasdaq (+45%) and the S&P 500 (+20%).
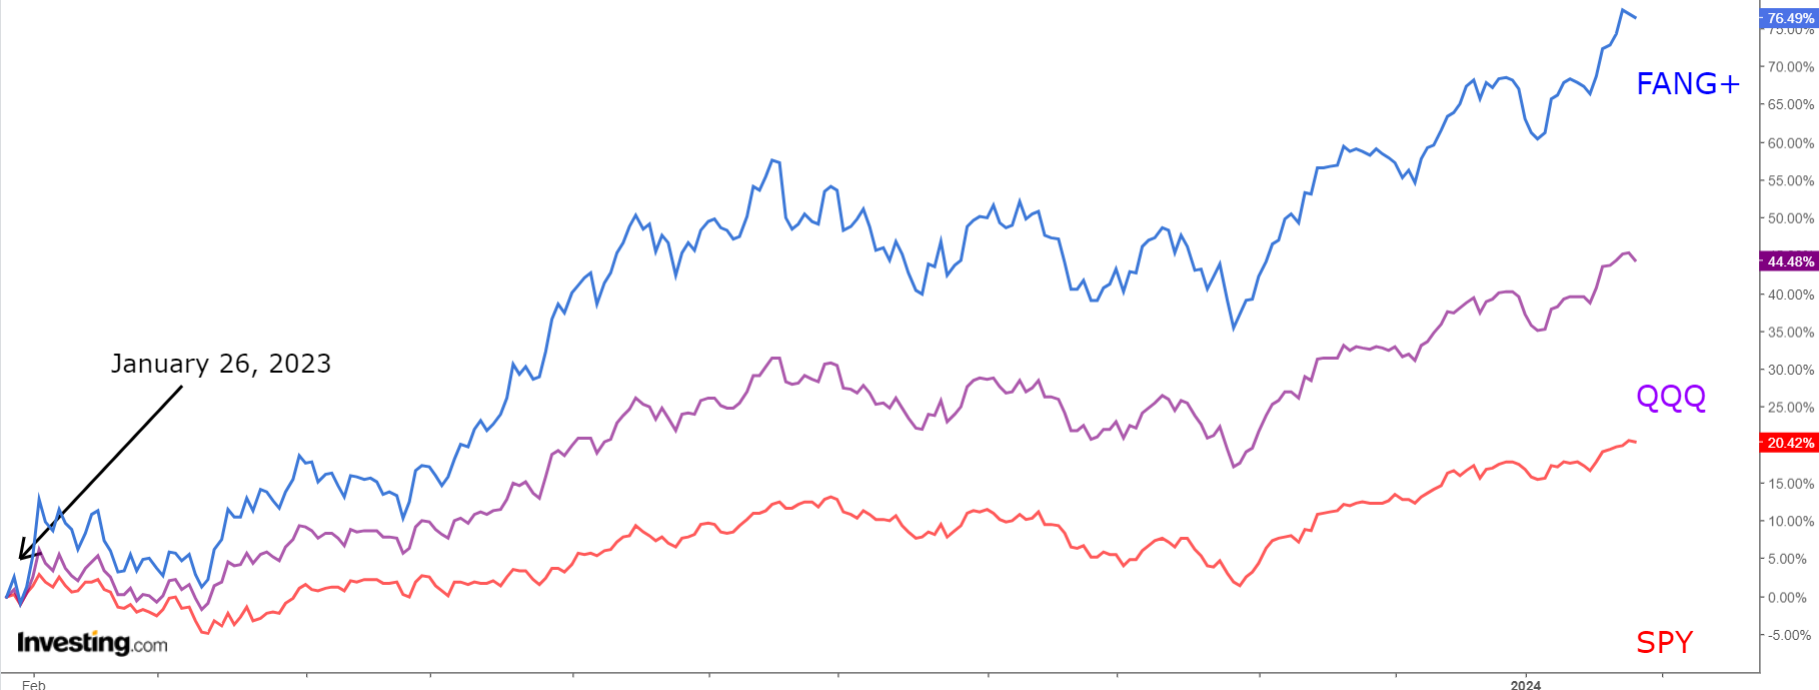
While this index encompasses names beyond the Magnificent 7, it serves as a significant gauge for assessing the strength of Mega-caps.
As 2023 concluded with Magnificent 7 dominating the market, the trend has persisted into 2024.
The Magnificent 7, with the recent surge of Netflix (NASDAQ:NFLX) following positive earnings data, appears to be maintaining its outperformance.
Meanwhile, Tesla (NASDAQ:TSLA) seems to be potentially making way for other contenders.
5. The Market Is Not Moving Into Commodities
If we are looking for reversals, and what level of risk the market is taking, the ratio of Consumer Staples (NYSE:XLP) to the S&P 500 gives us a very clear signal:
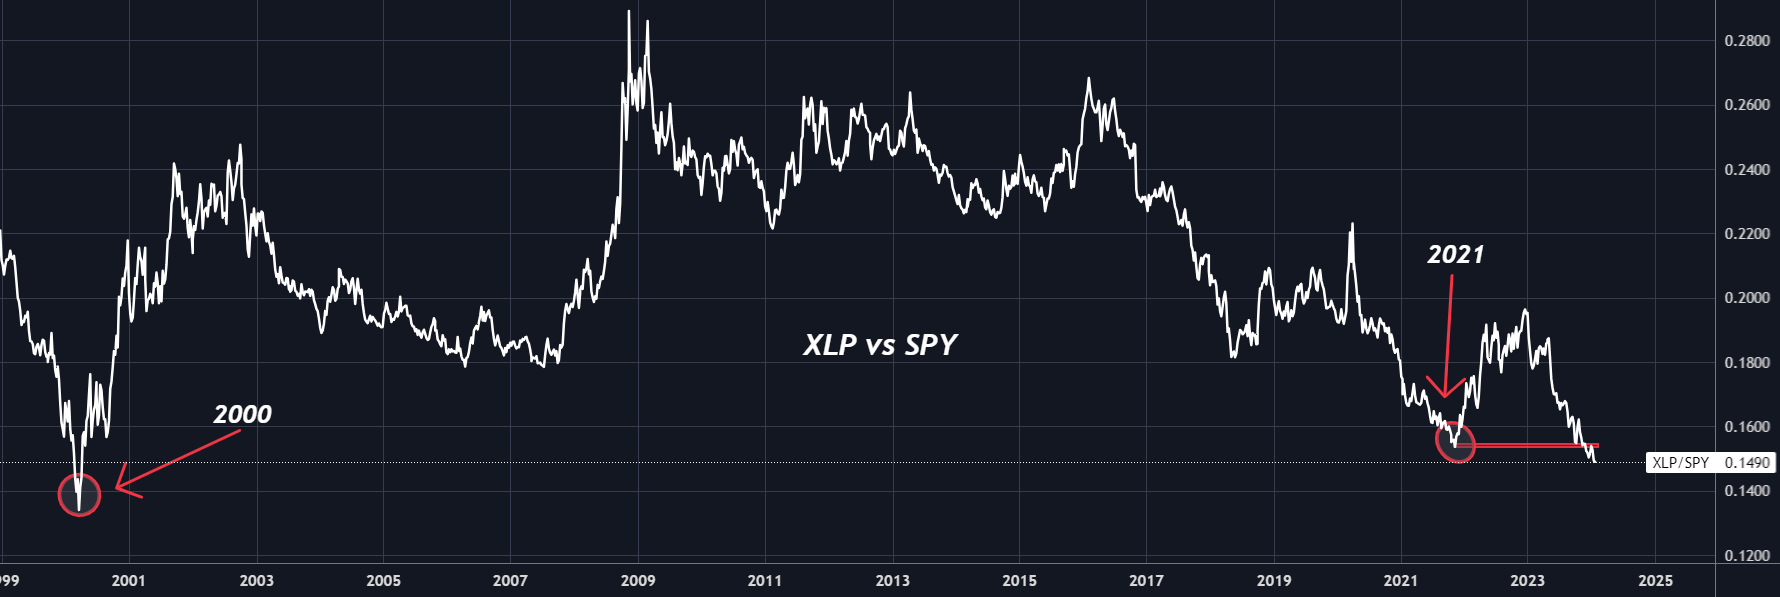
The current bullish sentiment finds support in the steadily declining ratio observed throughout the previous year, affirming the presence of a bullish market.
This trend in the ratio persists as it breaks the 2021 lows and extends toward the levels seen in 2000.
6. Volatility Still Remains Low
The fear index, the CBOE Volatility Index, has maintained low levels since November 2023, remaining below the 15 level.
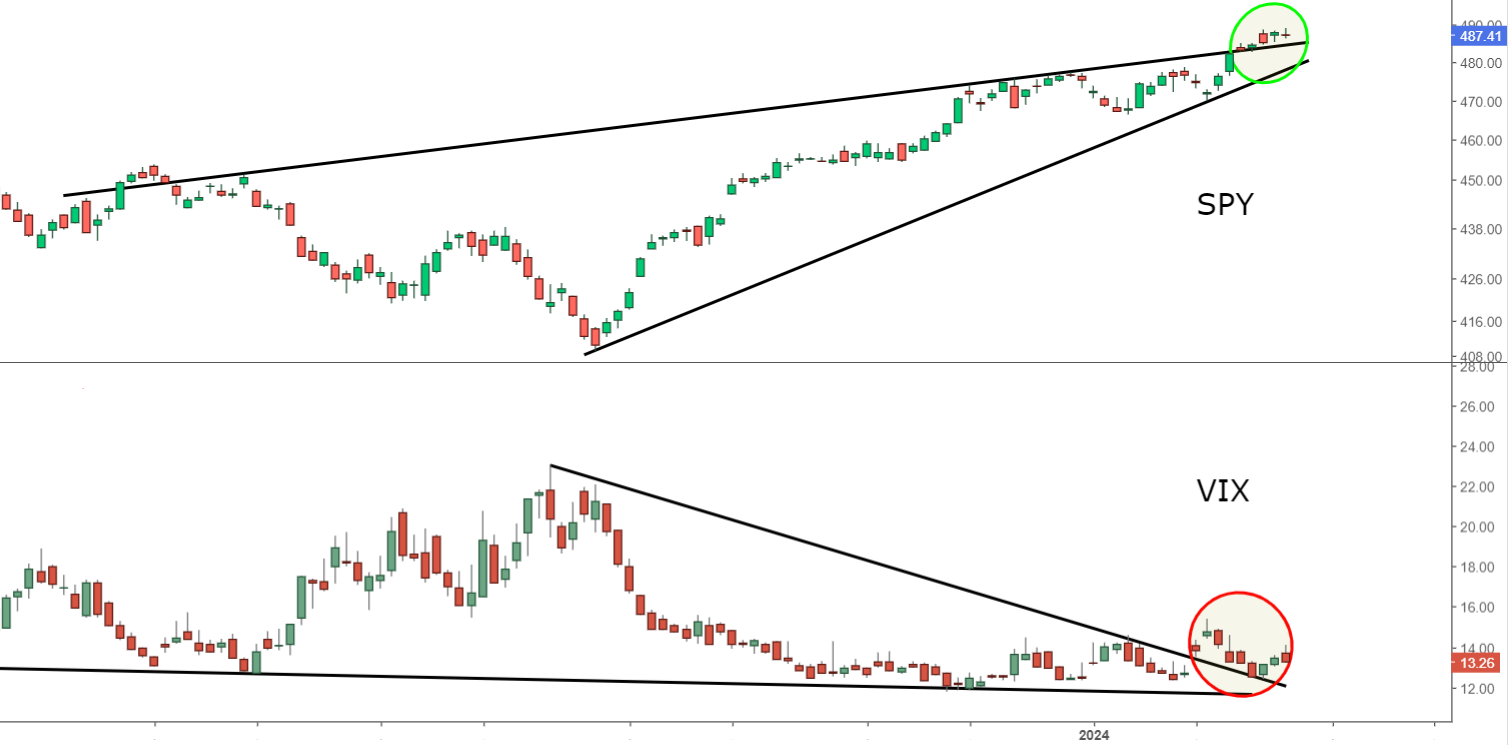
However, a potential confirmation of a bullish trend in the coming months, pushing towards the 20 level, might unsettle the market and expose investors to increased risk.
Conclusion: There Is No Best Time to Invest
The common advice to "wait and see what direction the market will take" might discourage investors, implying there's never an ideal time.
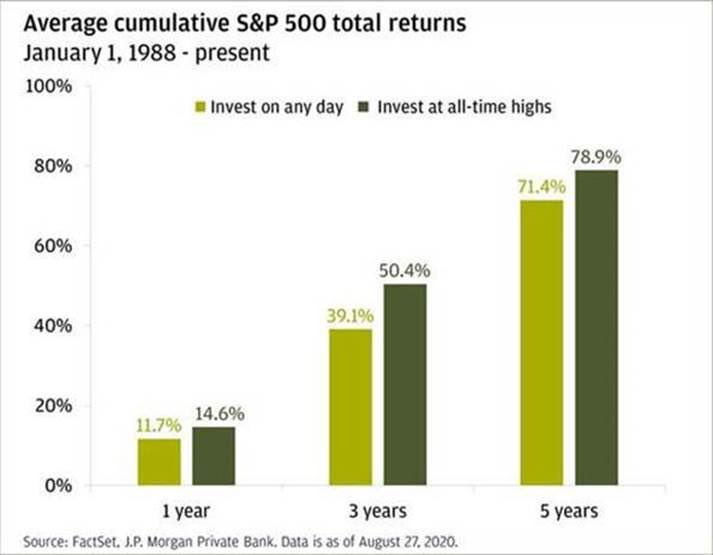
However, the cumulative average total returns chart of the S&P 500 contradicts this notion.
It shows that investing at historical highs doesn't hinder performance over a 1 to 5-year period, challenging the idea that waiting for a perfect moment is necessary.
So, as an investor, avoid waiting for the perfect time to invest, as it simply does not exist.
***
Take your investing game to the next level in 2024 with ProPicks
Institutions and billionaire investors worldwide are already well ahead of the game when it comes to AI-powered investing, extensively using, customizing, and developing it to bulk up their returns and minimize losses.
Now, InvestingPro users can do just the same from the comfort of their own homes with our new flagship AI-powered stock-picking tool: ProPicks.
With our six strategies, including the flagship "Tech Titans," which outperformed the market by a lofty 952% over the last decade, investors have the best selection of stocks in the market at the tip of their fingers every month.
________________________________________________________
Disclaimer: This article is written for informational purposes only; it does not constitute a solicitation, offer, advice, or recommendation to invest as such it is not intended to incentivize the purchase of assets in any way. I would like to remind you that any type of asset, is evaluated from multiple points of view and is highly risky and therefore, any investment decision and the associated risk remains with the investor.
