- Looking for help to undercover hidden gems? Look no further than ProPicks.
- This tool can make discovering high-potential stocks a breeze.
- In this piece, we will discuss 4 stocks that have caught ProPicks' eye and are set to outperform going ahead.
- In 2024, invest like the big funds from the comfort of your home with our AI-powered ProPicks stock selection tool. Learn more here>>
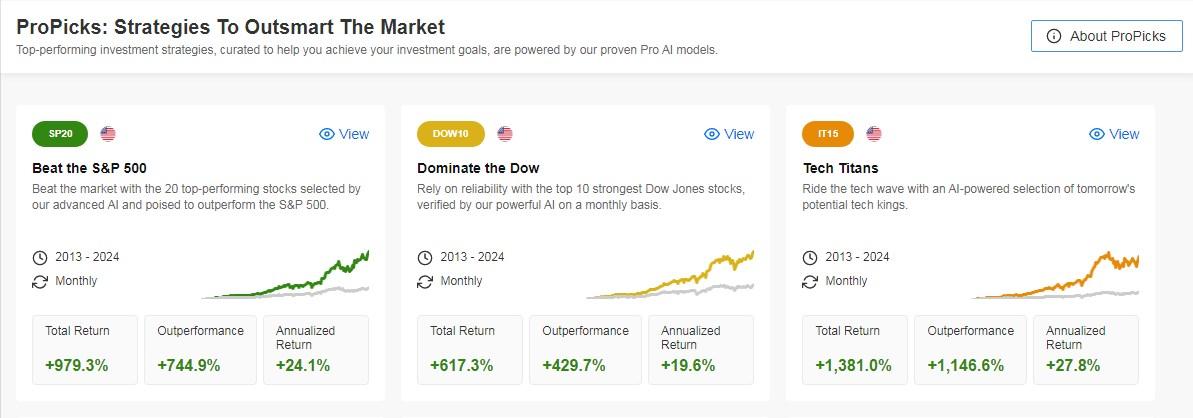
- It is made up of 20 companies from the S&P 500 index.
- Its Sharpe ratio is 1.04.
- Its annualized return is +24.1%.
- Consists of 10 companies in the Dow Jones Industrial Average index.
- Its Sharpe ratio is 1.07.
- Its annualized return is +19.6%.
- Consists of 15 companies from the S&P 500 index.
- Its Sharpe ratio is 0.96.
- Its annualized return is +27.8%.
- Consists of 20 companies in the S&P 500 index.
- Its Sharpe ratio is 1.05.
- Its annualized return is +22.9%.
- It is made up of 15 companies from the S&P 500 index, which may be the best stocks in Buffett's portfolio, and is analyzed and updated every quarter.
- Its Sharpe ratio is 0.81.
- Its annualized return is +15.7%.
- Consists of 20 companies in the S&P 500 index.
- Its Sharpe ratio is 0.76.
- Its annualized return is +20.1%.
Every investor dreams of not just making money on investments, but also having the ability to navigate the markets in a sound, balanced, and efficient way.
Let me introduce you to the new InvestingPro tool that could make that dream a possibility – ProPicks. This innovative tool uncovers hidden gems in the market, enabling strategic and well-informed investment decisions.
As you explore ProPicks, you will discover six investment portfolios, each embodying a distinct philosophy tailored to specific markets. Notably, monthly adjustments are made, signaling whether to sell one stock and acquire another.
These portfolios leverage artificial intelligence, fundamental analysis, and over 100 metrics to guide decisions on which stocks to buy or sell. Perhaps most compellingly, they consistently outperform the markets by a significant margin.
Here are some of the strategies available on the platform along with the performance:

Source: InvestingPro
Before delving into the portfolio, it's essential to understand the Sharpe ratio, which calculates return as a function of risk.
This ratio serves as a straightforward method to assess investment portfolio performance. The correlation is clear: the riskier the investment, the higher the anticipated return.
A higher Sharpe ratio indicates more effective risk management, with the portfolio return adequately compensating for the risk taken. Sharpe ratios surpassing 1 are considered highly favorable.
Now, let's swiftly go through each of them:
S&P 500 Portfolio:
Dow Jones Portfolio:
Technology Portfolio:
Undervalued Assets Portfolio:
Warren Buffett's Best of Warren Buffett Portfolio:
Mid-sized Stock Portfolio:
Now, let's delve into the essence of the article and explore four intriguing stocks unveiled by ProPicks.
These stocks not only caught the eye of ProPicks but also aligned with the market consensus. They form a crucial component of the six portfolios discussed above.
1. Ringcentral
Ringcentral (NYSE:RNG) offers cloud communications, video conferencing, and software solutions. The company was incorporated in 1999 and is headquartered in Belmont, California.
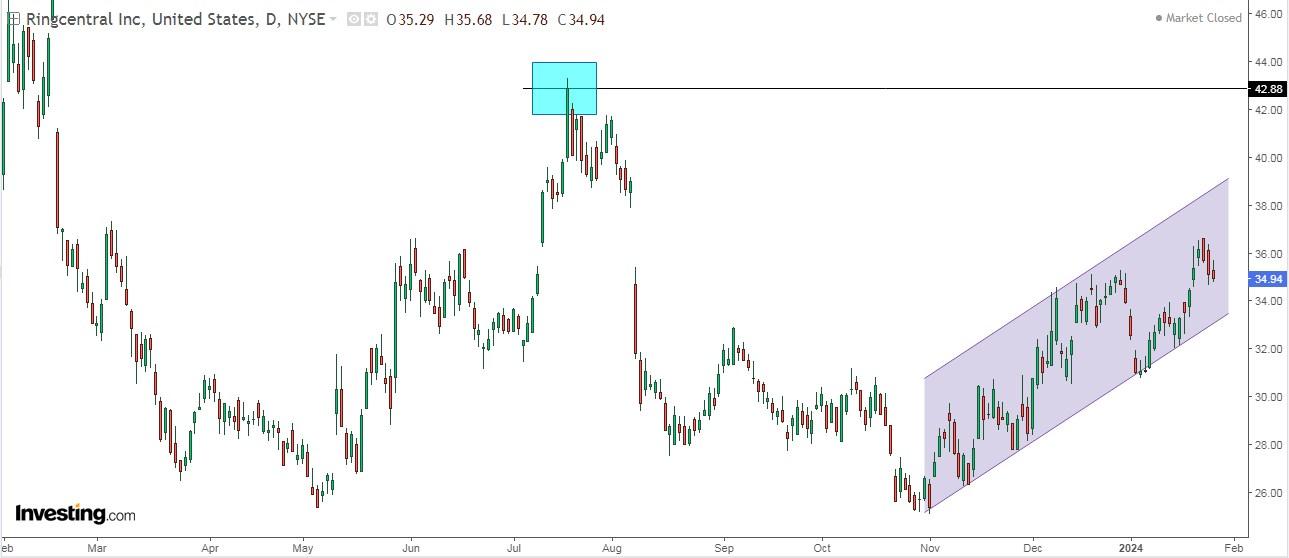
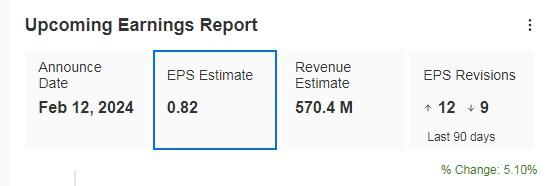
On February 12 it presents its accounts and is expected to increase earnings per share (EPS) by +5.10% and by 2024 by +9.9% along with revenue growth of +9.2%.
Source: InvestingPro
It presents 27 ratings, of which 14 are buy, 13 are hold and none are sell. InvestingPro models give it potential at $46.01.

Source: InvestingPro
2. Caesars Entertainment
Caesars Entertainment (NASDAQ:CZR) operates as a gaming and hospitality company in the United States. The company owns, leases, and manages properties in 16 states. It was founded in 1937 and is headquartered in Reno, Nevada.
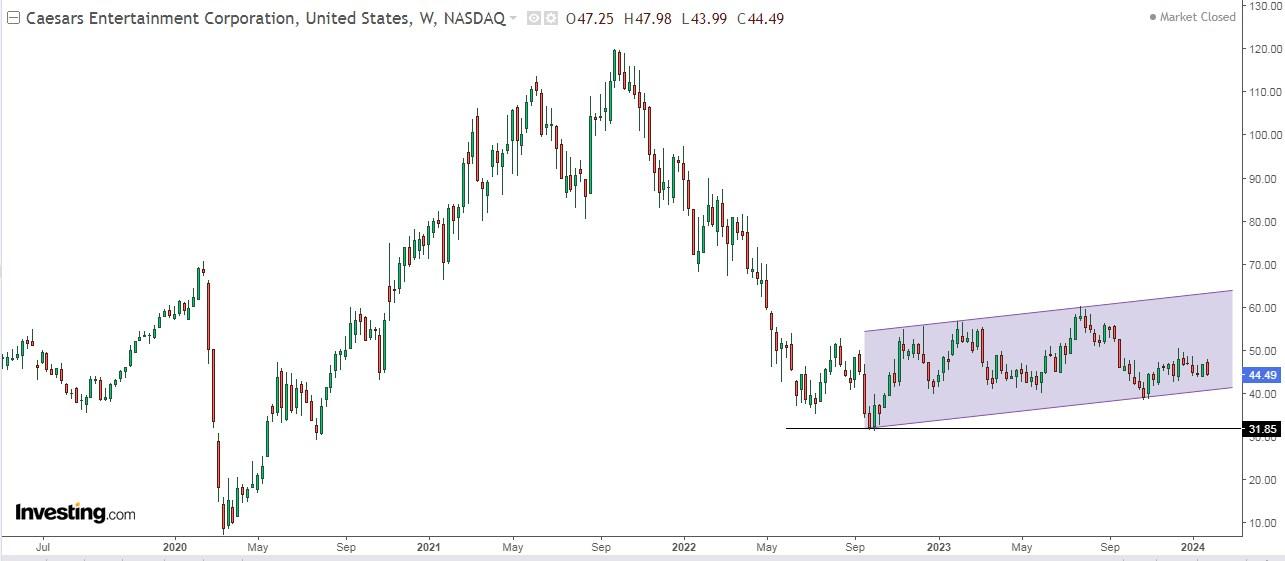
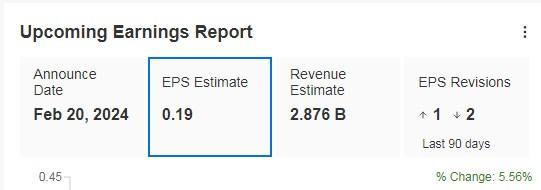
It reports its numbers on February 20 and is expected to report earnings per share (EPS) growth of +5.56%. For 2023, the expected increase in the EPS is +208.7%.
Source: InvestingPro
It has 16 ratings, of which 12 are buy, 4 are hold and none are sell. The market gives it a potential at $60.

Source: InvestingPro
3. Fox Factory Holding
Fox Factory Holding (NASDAQ:FOXF) designs, manufactures and markets dynamic driving products worldwide. The company was incorporated in 2007 and is headquartered in Duluth, Georgia.
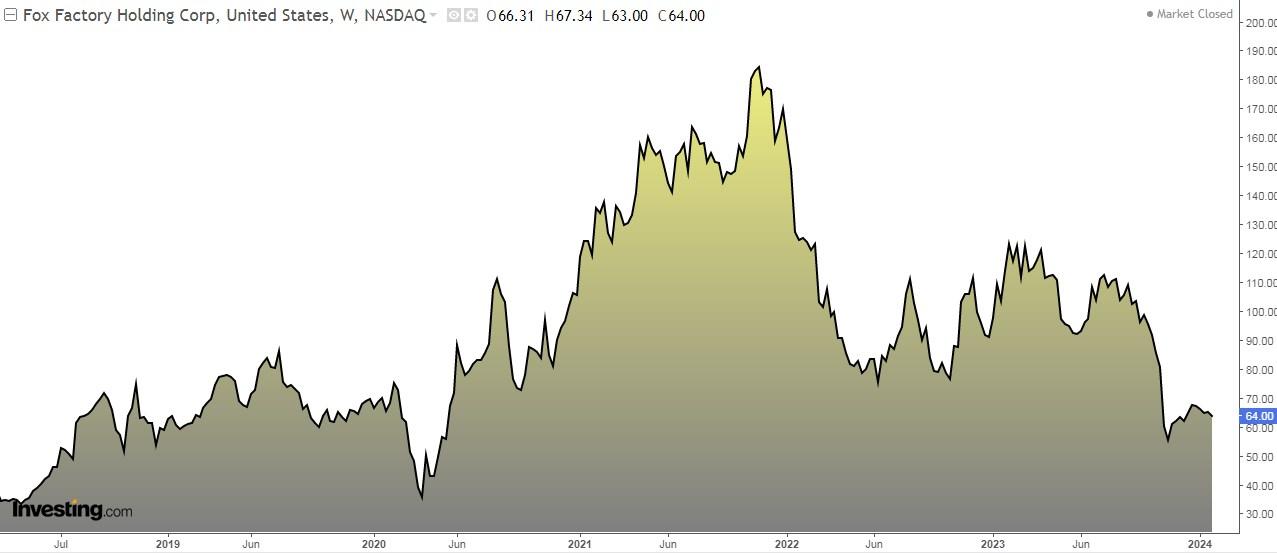
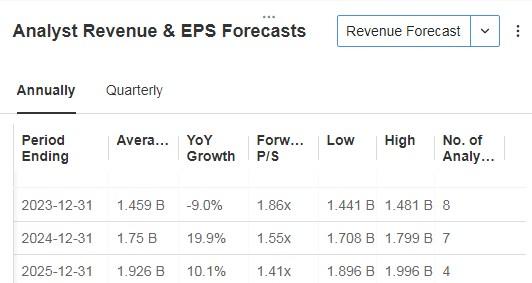
On February 22, we will know its earnings report. Looking ahead to 2024, earnings per share (EPS) are expected to increase by +12.9% and revenue by +19.9%.
Source: InvestingPro
It presents 8 ratings, of which 4 are buy, 4 are hold and none are sell. InvestingPro models give it potential at $87.95.

Source: InvestingPro
4. Euronet Worldwide
Euronet Worldwide (NASDAQ:EEFT) provides transaction and payment processing and distribution solutions to financial institutions, retailers, service providers, and individual consumers worldwide.
The company was formerly known as Euronet Services and changed its name to Euronet Worldwide in August 2001. It was founded in 1994 and is headquartered in Leawood, Kansas.
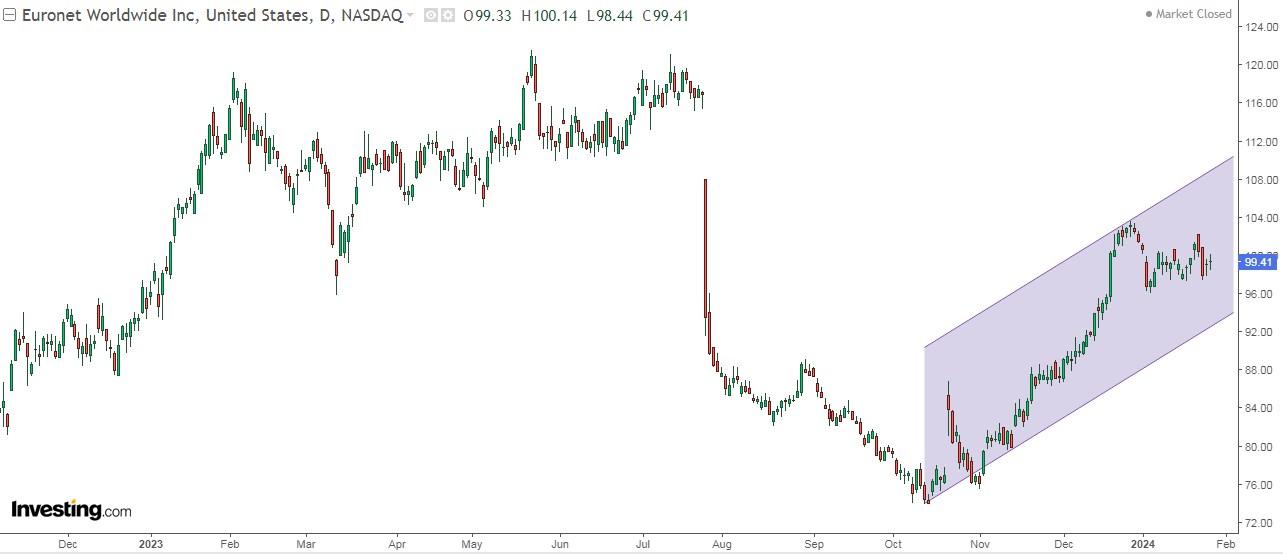
February 7 is the date when we will know its accounts. Earnings per share (EPS) are expected to increase by +10.75%. By 2024 the rise would be +13% and +8% in terms of revenue.

Source: InvestingPro
It has 10 ratings, of which 6 are buy, 4 are hold and none are sell.
More market players continue to add that they like the company for this year, the last one being Truist Securities that sees it at $115.

Source: InvestingPro
InvestingPro models see more potential, specifically at $129.15.

Source: InvestingPro
Want to see all the picks from our strategies?
Subscribe here for up to 50% off as part of our year-end sale and never miss a bull market again!
*Readers of this article an extra 10% off our annual and 2-year Pro+ plans with codes UKTopDiscount and UKNewYear2. Limited time offer - act now!
Disclaimer: This article is written for informational purposes only; it does not constitute a solicitation, offer, advice, or recommendation to invest as such it is not intended to incentivize the purchase of assets in any way. I would like to remind you that any type of asset, is evaluated from multiple points of view and is highly risky therefore, any investment decision and the associated risk remains with the investor.

