
- Banking sector giant Goldman Sachs shares have lost 8.5% since the beginning of 2022
- Q4 earnings missed estimates
- Long-term investors could consider buying shares at current levels
- Global Markets (37% of revenue, divided between Equities and Fixed Income, Currency and Commodities, FICC);
- Asset Management (25% of revenue);
- Investment Banking (25% of revenue); and
- Consumer & Wealth Management (13%).
- iShares U.S. Broker-Dealers & Securities Exchanges ETF (NYSE:IAI)
- SPDR Dow Jones Industrial Average ETF Trust (NYSE:DIA)
- First Trust Dow 30 Equal Weight ETF (NYSE:EDOW)
- Financial Select Sector SPDR® Fund (NYSE:XLF)
- Invesco S&P 500® Momentum ETF (NYSE:SPMO)
Global investment bank Goldman Sachs (NYSE:GS) shares have been weak since the release of Q4 results in mid-January. So far this year, the stock is down 8.48%. Yet, in the past 12 months, shares gained 9.6%.

By comparison, the Dow Jones Industrial Average—the 30-component mega cap index that includes GS—is down 6.3% year-to-date, but up 10.0% in the last year. Meanwhile, the Dow Jones Financials, which returned 16.8% over the past 52 weeks, has lost 2.7% since January.
On Nov. 2, 2021, GS shares went over $426 to hit a record high. Now, however, they're changing hands for $350.12. The stock’s 52-week range has been $316.46-$426.16, while the market capitalization (cap) stands at $117.2 billion.
Despite the recent decline in price, Goldman Sachs bulls could consider investing around current levels. Here’s why:
Where Recent Earnings Came From
In terms of global revenues among investment banks, JPMorgan Chase (NYSE:JPM) has the top spot with a 9.6% market share. Next come Goldman Sachs (9.0%), Morgan Stanley (NYSE:MS) with 6.7% and Bank of America (NYSE:BAC) with 6.4%.
When we look at the league table for mergers and acquisitions (M&A), Goldman Sachs is ahead of JPM, followed by MS which is why Wall Street pays close attention to quarterly reports from these global giants.
Goldman Sachs released Q4 financials Jan. 18. Revenue was $12.64 billion, an increase of 8% year-over-year (YoY). The bank reports revenue in four segments:
Investors noted that higher net revenues in Investment Banking and Consumer & Wealth Management segments partially offset the decline in Asset Management and Global Markets.
Diluted earnings per share for the period was $10.81, compared with $12.08 a year ago. Analysts were looking for a profit of $11.76 per share. Pressure on the bottom line was from rising expenses as well as weaker trading revenues.
Annualized return on equity (ROE) was 15.6% for the quarter, but 23% for 2021. Many of our readers would know that investors regard ROE as an important measure of a bank profitability. Metrics from InvestingPro suggest that Goldman Sachs has a higher ROE than its peers (15.9%).
On the results, CEO David M. Solomon highlighted that 2021 had been a record year for the banking giant. Meanwhile, management’s medium-term (approximately 3-year time horizon) firmwide ROE target is 14-16%.
Prior to the release of the quarterly results, the stock was around $380. But now, it is trading slightly over $350. The current price supports a dividend yield of close to 2.3%.
What To Expect From Goldman Sachs Stock
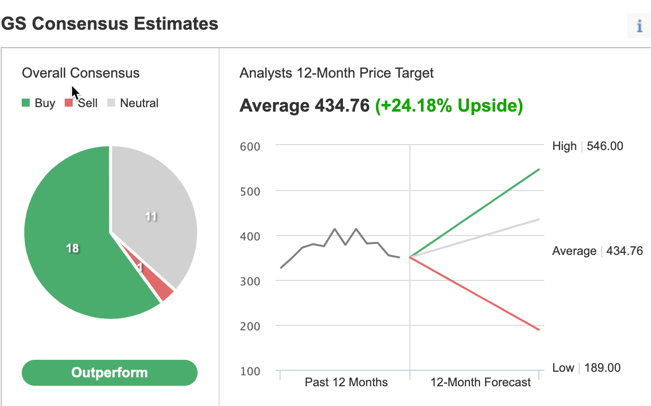
Among 30 analysts polled by Investing.com, GS stock has an "outperform" rating.
Source: Investing.com
Wall Street also has a 12-month median price target of $434.76 for the stock, implying an increase of more than 24% from current levels. The 12-month price range currently stands between $189 and $546.
Similarly, according to a number of valuation models, like those that might consider P/E or P/S multiples or terminal values, the average fair value for Goldman Sachs stock via InvestingPro stands at $436.58. In other words, the fundamental valuation also suggests shares could increase close to 25%.
We can also look at Goldman Sachs stock’s financial health as determined by ranking more than 100 factors against peers in the financial sector. For instance, in terms of growth, profit, relative value, and price momentum, it scores 3 out of 5. Its overall score of 3 points is a good performance ranking.
At present, P/E, P/B, and P/S ratios for GS are 5.5x, 1.2x, and 2.0x. Comparable metrics for peers stand at 10.1x, 1.8x, and 1.7x. These numbers suggest that following the recent decline, Goldman Sachs shares offer better value than they did several months ago.
Our expectation is for Goldman Sachs stock to build a base between $340 and $360 in the coming weeks. Afterwards, shares could potentially start a new leg up.
Adding GS Stock To Portfolios
Goldman bulls who are not concerned about short-term volatility could consider investing now. Their target price would be $434.76, analysts’ forecast.
Alternatively, investors could consider buying an exchange-traded fund (ETF) that has GS stock as a holding. Examples include:
Finally, those who expect Goldman Sachs stock to bounce back in the weeks ahead could consider setting up a bull call spread.
Most option strategies are not suitable for all retail investors. Therefore, the following discussion on GS stock is offered for educational purposes and not as an actual strategy to be followed by the average retail investor.
Bull Call Spread On Goldman Sachs Stock
Price At Time Of Writing: $350.12
In a bull call spread, a trader has a long call with a lower strike price and a short call with a higher strike price. Both legs of the trade have the same underlying stock (i.e.,Goldman Sachs) and the same expiration date.
The trader wants GS stock to increase in price. In a bull call spread, both the potential profit and the potential loss levels are limited. The trade is established for a net cost (or net debit), which represents the maximum loss.
Today’s bull call spread trade involves buying the May 20 expiry 360 strike call for $14.80 and selling the 370 strike call for $10.90. Buying this call spread costs the investor around $3.90 or $390 per contract, which is also the maximum risk for this trade.
We should note that the trader could easily lose this amount if the position is held to expiry and both legs expire worthless, i.e., if the GS stock price at expiration is below the strike price of the long call (or $360 in our example).
To calculate the maximum potential gain, we can subtract the premium paid (or $3.90) from the spread between the two strikes (or $10.00), and multiply the result by 100. In other words: ($10.00 - $3.90) x 100 = $610.
The trader will realize this maximum profit if the Goldman Sachs share price is at or above the strike price of the short call (higher strike) at expiration (or $370 in our example).
Bottom Line
Since November 2021, Goldman Sachs stock has come under significant pressure. Yet, the slide has improved the margin of safety for buy-and-hold investors who could consider buying soon.
Alternatively, experienced traders could also set up an options trade to benefit from any potential rally in the price of GS stock.