- Both the Nasdaq and S&P 500 have pulled back slightly after hitting record highs.
- But it's not just tech - a key indicator shows broad market strength, but with a potential warning sign on the horizon.
- Investor behavior is also bullish, with high-yield bonds and growth stocks outperforming.
- Invest like the big funds for under $9/month with our AI-powered ProPicks stock selection tool. Learn more here>>
The stock market may be a complex beast, brimming with information and conflicting opinions, but one thing's clear: it has been on a tear. The Nasdaq has been setting new all-time highs, extending its winning streak to six weeks.
Meanwhile, the S&P 500 is shattering records with its longest streak of highs, surpassing a 68-year record of 27 highs set in 1954. It's been over 322 days since the index last closed down more than 2%.
Big tech remains the driving force behind this bullish trend, and that's no surprise. Historically, tech stocks have dominated bull markets, consistently outperforming other sectors, and are continuing to do so today.
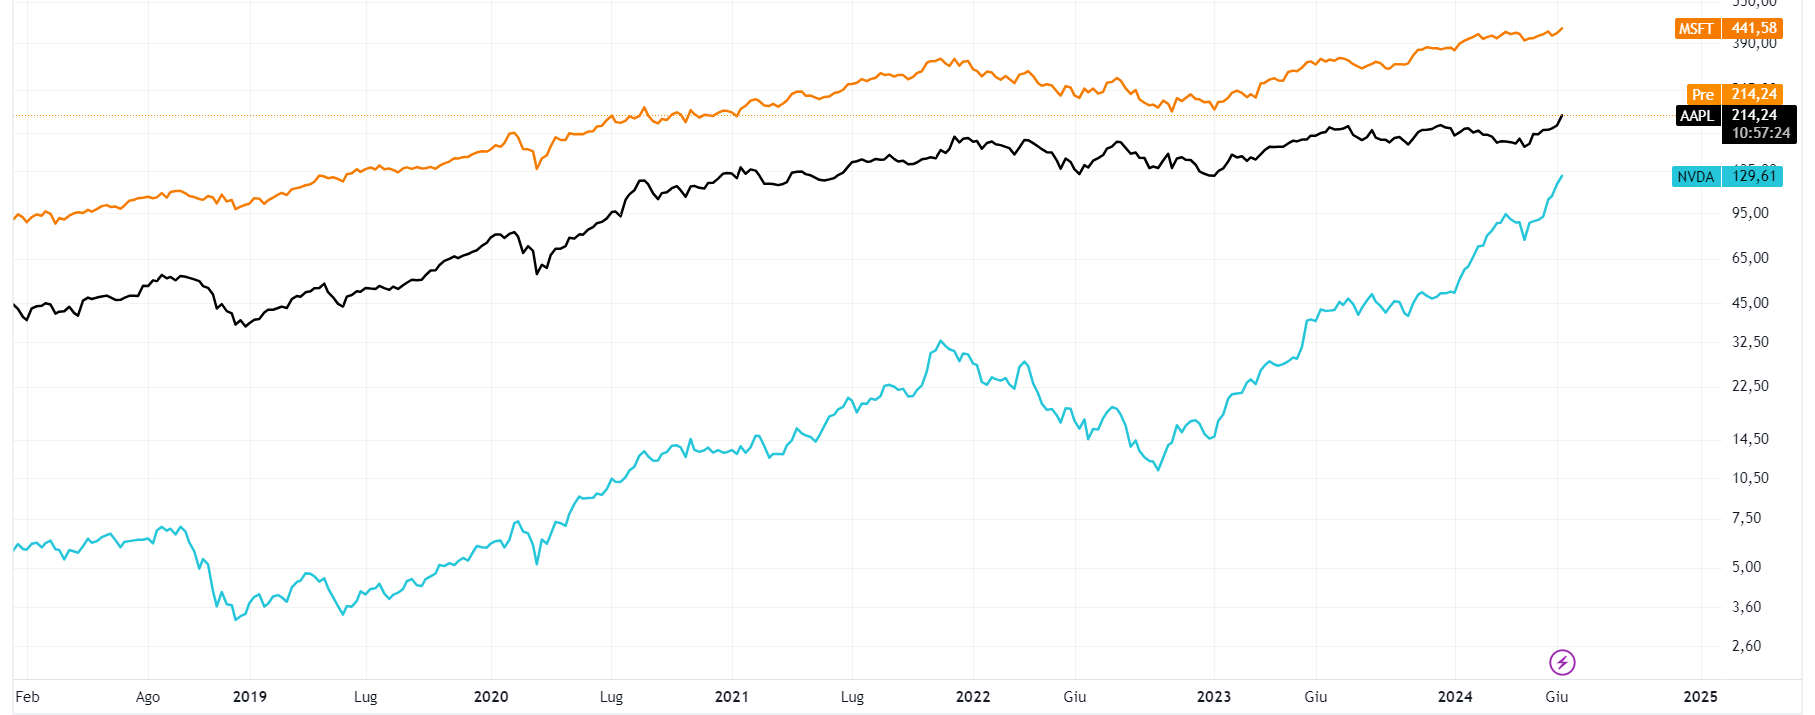
Just look at Apple (NASDAQ:AAPL), Microsoft (NASDAQ:MSFT) and Nvidia (NASDAQ:NVDA) - they are all leading the gains. 
1. Majority of Stocks Trade Above 200 MA
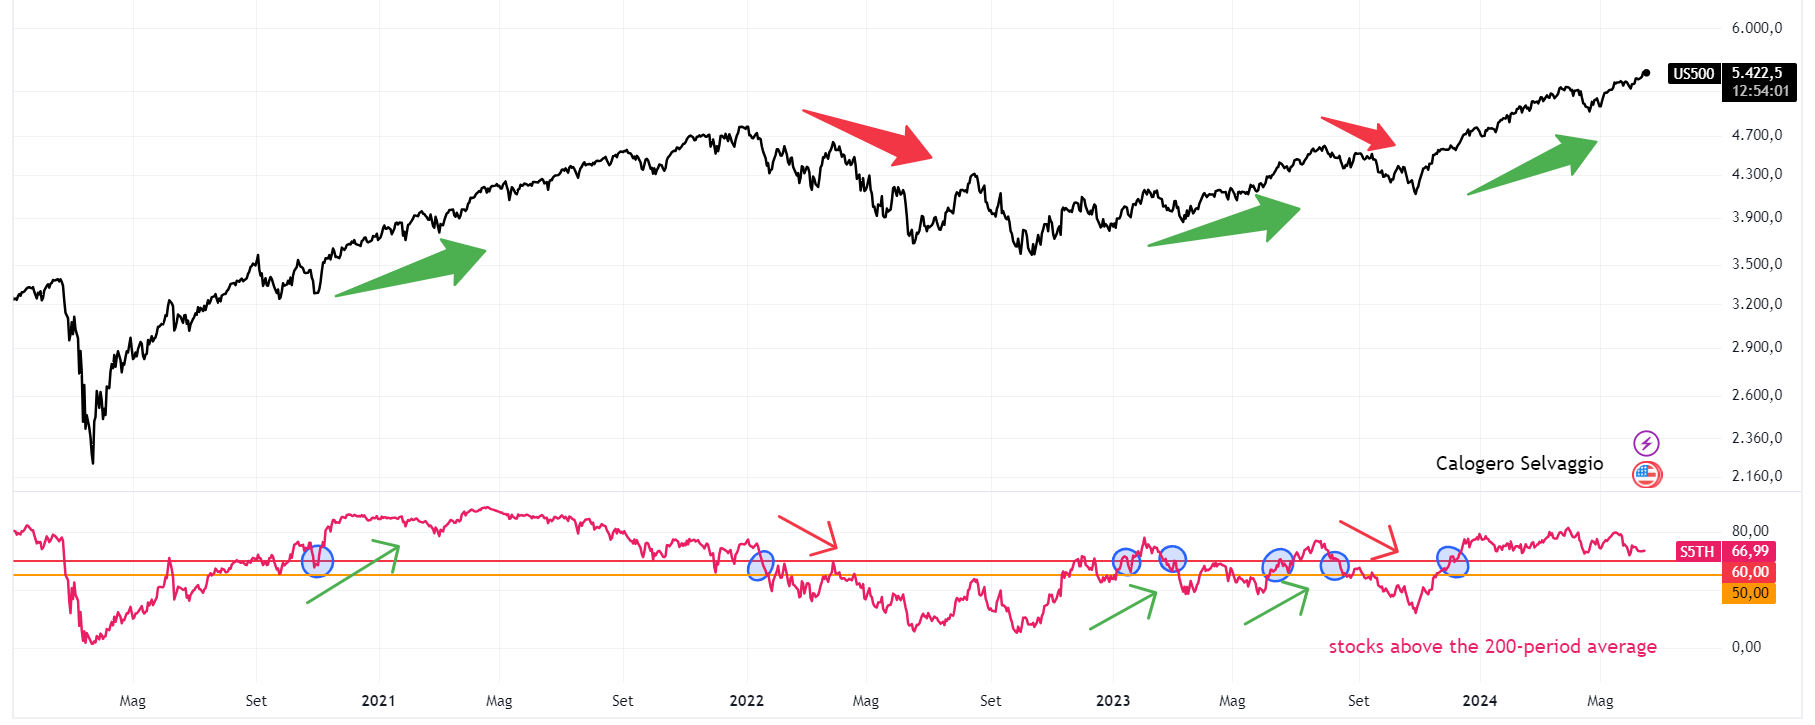
Further bolstering the bullish case, a key indicator shows that over two-thirds of stocks are currently trending above their 200-day average, a historically bullish signal. This level, currently at 66.9%, has often preceded positive returns in the past.

However, a potential storm cloud looms on the horizon. A drop below 60% in this indicator could trigger investor concern and disrupt the current uptrend. Thankfully, there's no sign of that happening just yet.
2. High-Yield Bonds Continue to Do Well
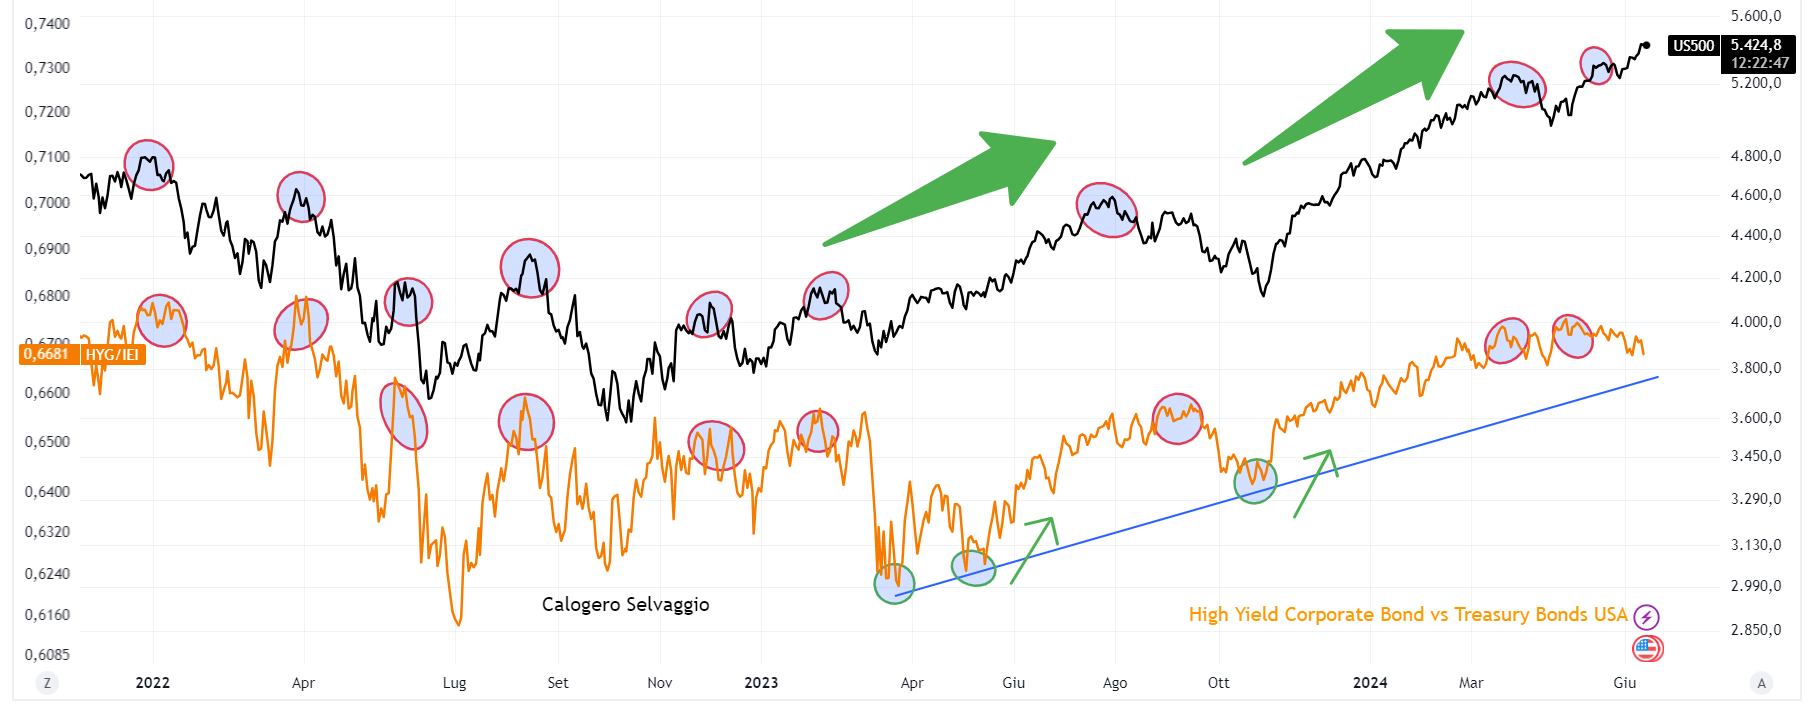
Another indicator, the ratio of high-yield bonds (NYSE:HYG) to U.S. Treasuries (NASDAQ:IEI), suggests a lack of defensive rotation by investors. This ratio typically rises when investors shift toward safer assets like Treasuries during periods of uncertainty.

3. High Beta Continues to Outperform
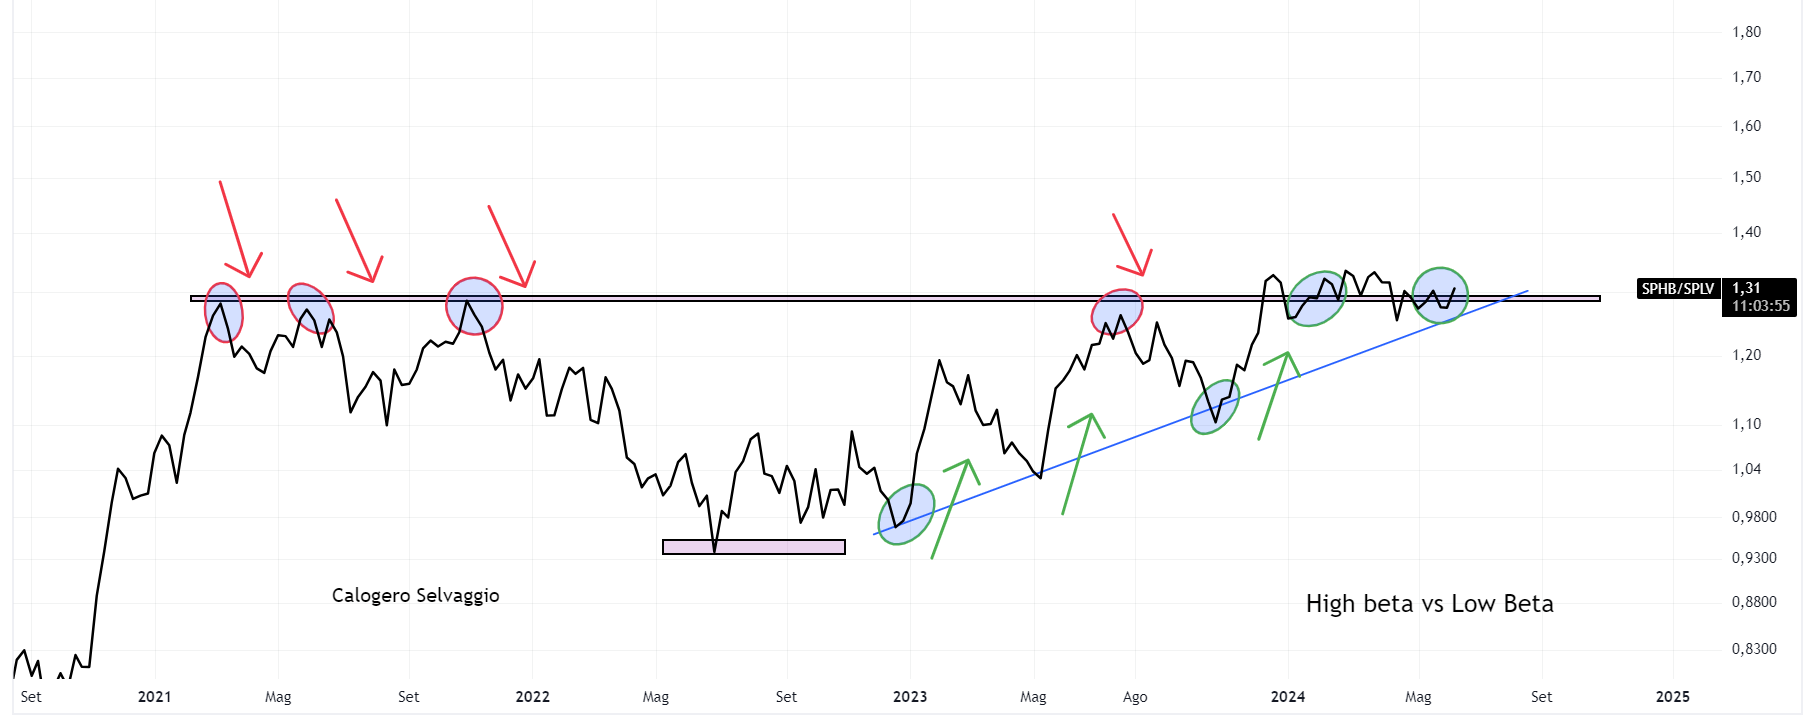
Finally, the High Beta (NYSE:SPHB) vs. Low Beta (NYSE:SPLV) ratio reinforces the continuation of the bullish trend. High-beta sectors, known for their volatility and growth potential, are currently outperforming their Low-beta counterparts. This pattern, which began in June 2022, indicates investor confidence in riskier assets and a preference for growth over stability.

The Bottom Line
While the market can change quickly, current data overwhelmingly points to a continuation of the bull run. Strength across various sectors and investor behavior all suggest a bullish outlook.
However, it's important to remember that future performance is never guaranteed. Stay informed and adjust your strategy as market conditions evolve.
***
Become a Pro: Sign up now! CLICK HERE to join the PRO Community with a significant discount.
Disclaimer: This article is written for informational purposes only; it does not constitute a solicitation, offer, advice, counseling or recommendation to invest as such it is not intended to incentivize the purchase of assets in any way. As a reminder, any type of asset is evaluated from multiple points of view and is highly risky therefore, any investment decision and the associated risk remains with the investor. The author owns shares in the company mentioned.

