- Apple cuts spending at least until 2023 in the latest sign of big-tech weakness
- History teaches us that market leaders always change
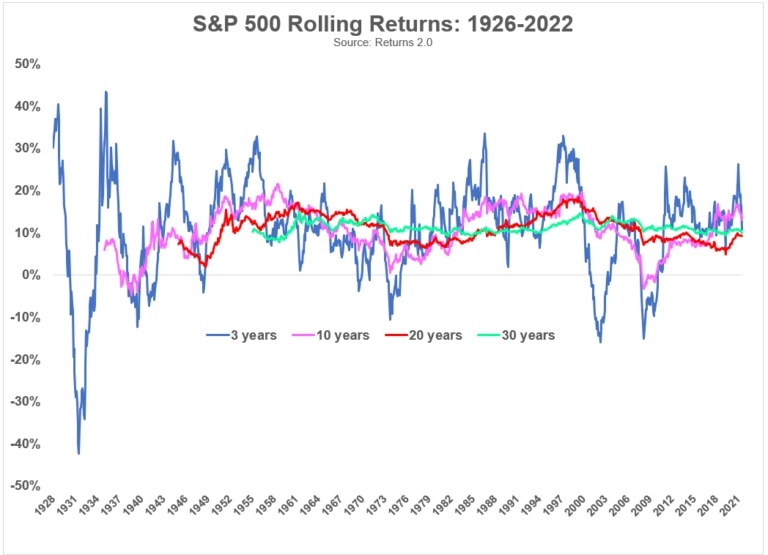
- Data shows that stock market returns converge much more toward positive average values as investment time increases
Yesterday's big news was that the world's largest company, Apple Inc (NASDAQ:AAPL), will slow hiring and lower general spending at least until 2023 to fight growing recession risks.
The announcement caused a broad selloff in the U.S. markets, which had started the day on a positive note, especially in the tech sector, as investors weighed that even market behemoths are not immune to hard times. Wall Street opened today with a rebound, but the NASDAQ 100 remains in a bear market.
Apple is not the first big-tech company to announce such measures. Meta Platforms (NASDAQ:META) and Tesla (NASDAQ:TSLA) are also undergoing similar budget cuts—a sign of growing risks to the sector as a whole.
History teaches that market leaders come and go. Below, you will find the list of the largest US companies from 1960 to the present. See how, over time, the sectors and individual companies leading broad market gains have entirely changed.
Source: CharlieBilello
That is why betting on a single company is always uncertain, regardless of its consolidated market position. Alternatively, it is better to diversify to increase the odds of stable long-term gains.
And there's also the time factor, an element I have repeatedly emphasized as critical to success in the investment world.
In the picture below, you see how stock market returns converge much more toward positive average values (in the S&P 500 index) as time increases. Also, the volatility typically associated with short periods is considerably smoothed out.
So here we come back to the fundamental concept of risk, which is not so much of experiencing price fluctuations, but of losing your gains to inflation over time, or worse yet, losing your money entirely.

Source: Returns 2.0
Finally, to return to the present day, here is an interesting thing: it does indeed appear that the so-called insiders (those who usually hold key positions or are important shareholders in listed companies) are back to buying.
If you notice the bottom of the chart, you can see how usually these people tend to be always at the right time, with their investment going up with 3-month and 1-year return rates of 100%. In short, they seem to be great at buying at the right time.

Source: Callum Thomas
Although this could be good news for a recovery in prices, only time can tell if we are right. However, if we buy steadily, with due patience (see picture above), the statistics show that the markets tend to agree with us.
Disclaimer: The author currently holds long positions in the S&P 500 index.
