Given the recent volatility in broader markets, many investors are seeking stability.
Utilities are considered a strong defensive play given the consistent demand for water, gas and electricity no matter the market conditions. In most countries, these firms have regulated business models, which would typically yield modest but steady profits.
The highly cash-generative nature of utilities translates into regular cash flows. As a result, utility shares usually offer robust dividends, which are particularly appealing considering a large number of companies across various industries have trimmed or fully axed their dividends since March. While researching companies that are likely to keep paying dividends in the coming quarters, it is essential to see if a company's earnings can support the payout.
Another positive factor for utility companies: lower interest rates in the US and in other countries. Because utility companies tend to carry high levels of debt on their balance sheets, lower interest rates can boost their bottom lines, giving them safe-haven appeal.
Exchange-traded funds (ETFs) enable investors to gain exposure to a range of utility companies while avoiding company-specific risks. Here are two worth considering:
1. Utilities Select Sector SPDR Fund
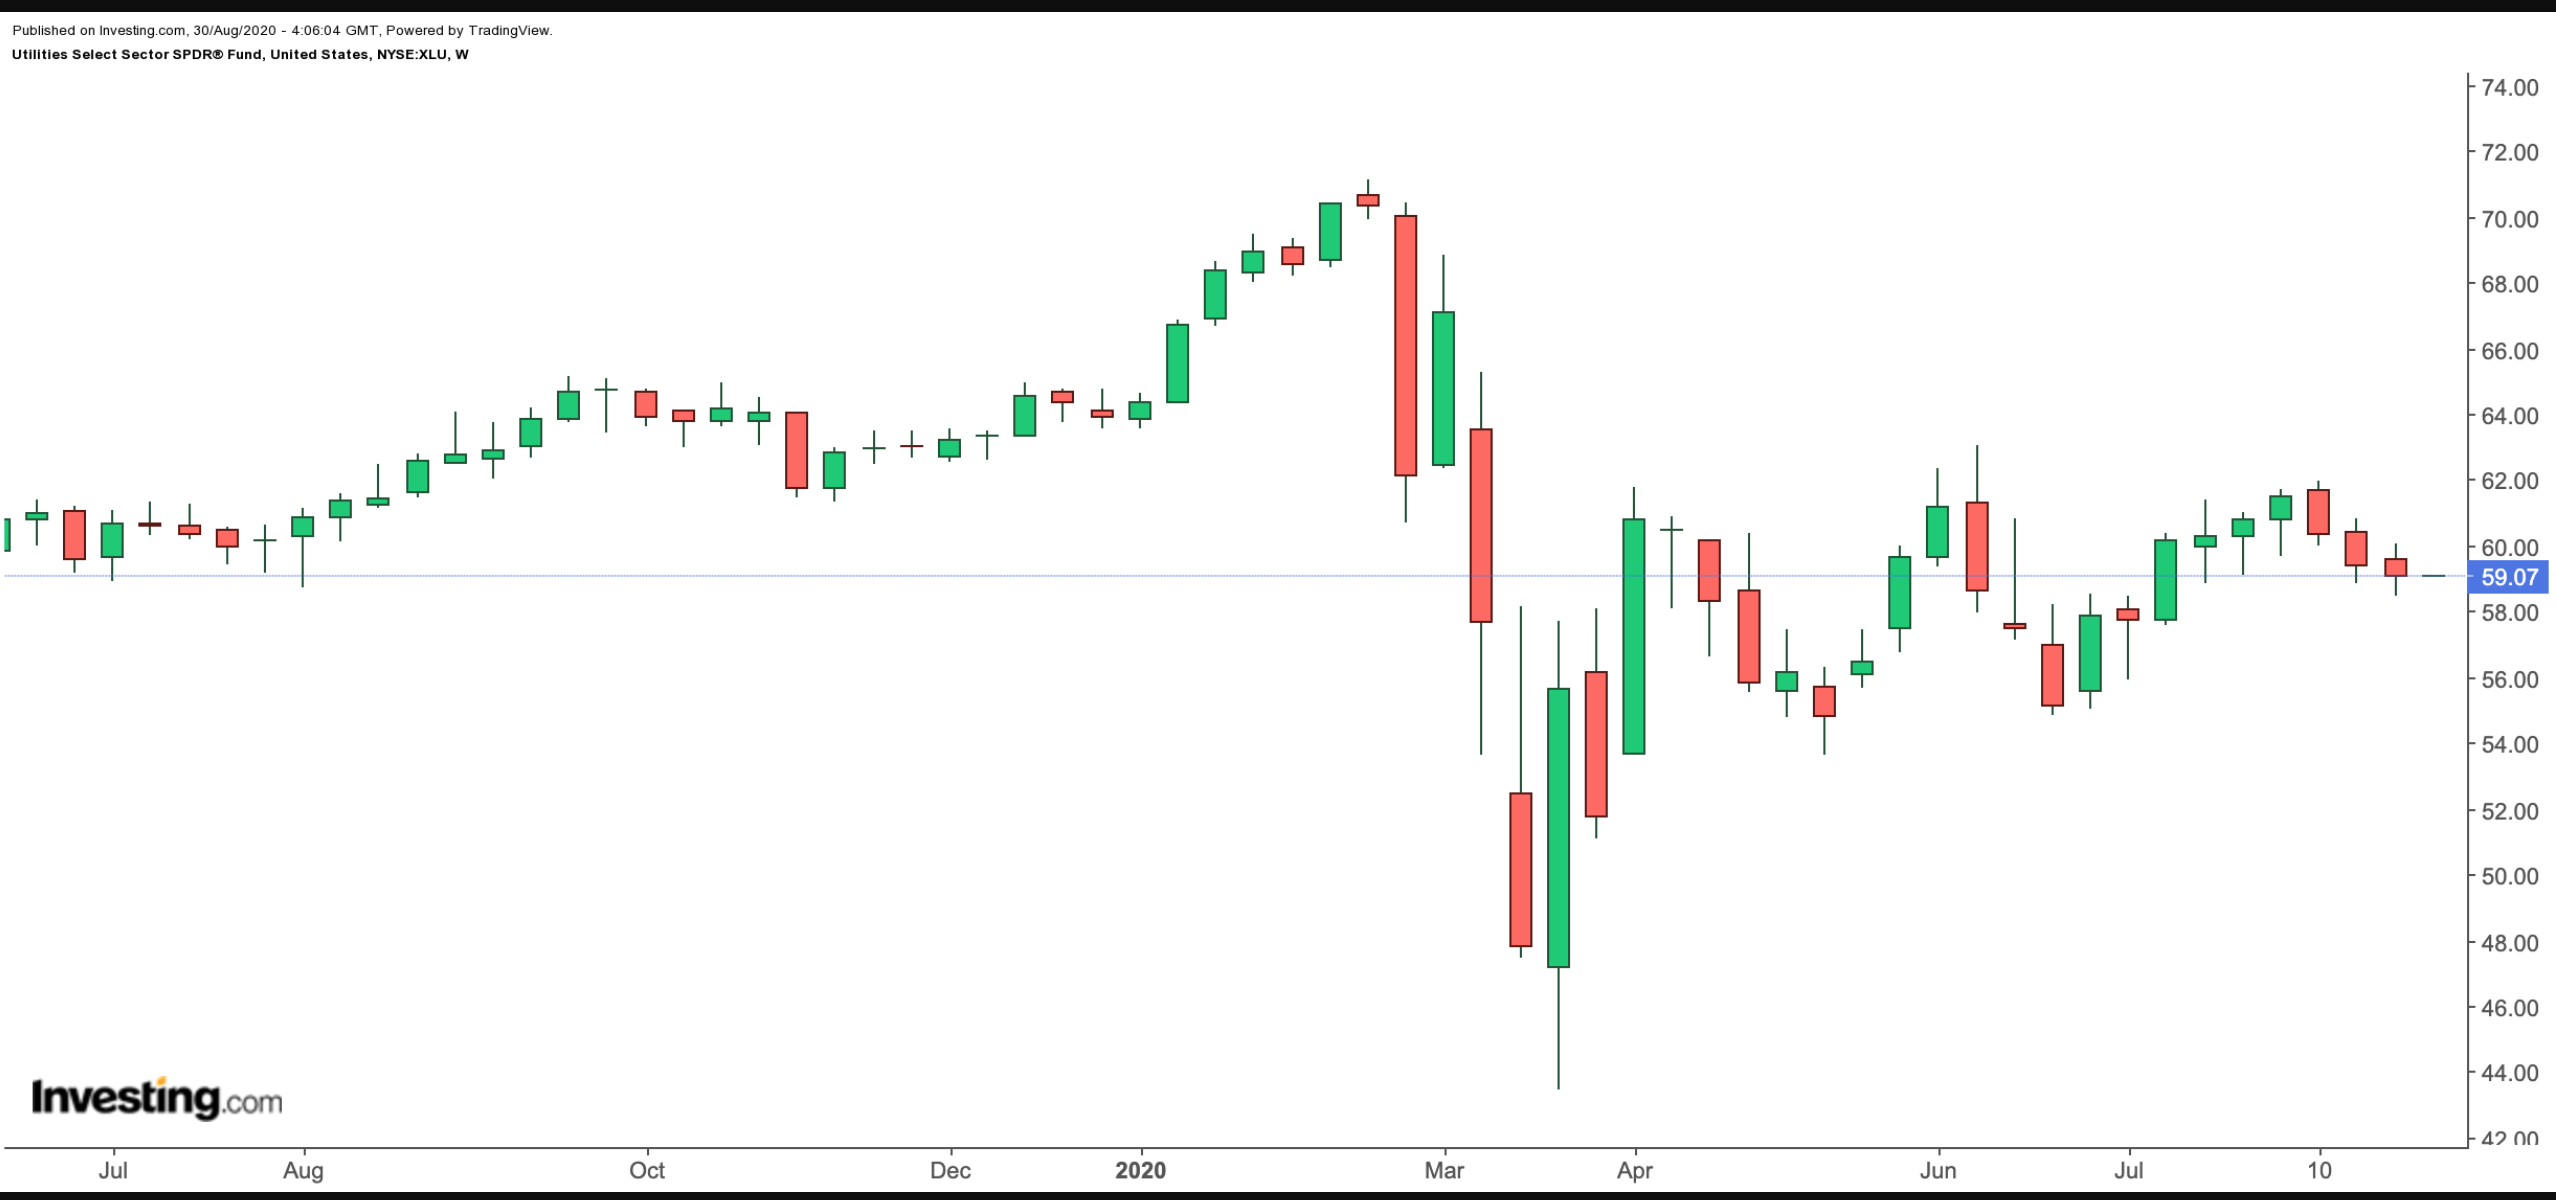
- Current Price: $59.07
- 52-Week Range: $43.44-$71.10
- Dividend Yield: 3.29%
- Expense Ratio: 0.13 % per year, or $13 on a $10,000 investment
The Utilities Select Sector SPDR® Fund (NYSE:XLU) provides exposure to companies from the utilities, independent power producers and energy trader industries. The fund was first listed in December 1998.
XLU, which tracks the Utilities Select Sector Index, includes 28 holdings. The most important sectors (by weighting) are Electric Utilities (62%), Multi-Utilities (32%), Water Utilities (3%), Gas Utilities (1.5%) and Independent Power and Renewable Electricity Producers (1.5%)

The top ten holdings make up approximately 65% of total assets under management, which stands close to $12 billion. XLU's largest five companies are NextEra Energy (NYSE:NEE), Dominion Energy (NYSE:D), Duke Energy (NYSE:DUK), Southern Company (NYSE:SO) and American Electric Power Company (NYSE:AEP).
So far in the year, the fund is down 8.5%. However, it is up about 40% since the lows seen in March. XLU's forward P/E and P/B ratios are 18.57 and 2.06, respectively. Long-term investors may consider buying the dips, especially if the fund moves toward the $55-level.
2. iShares Global Infrastructure ETF
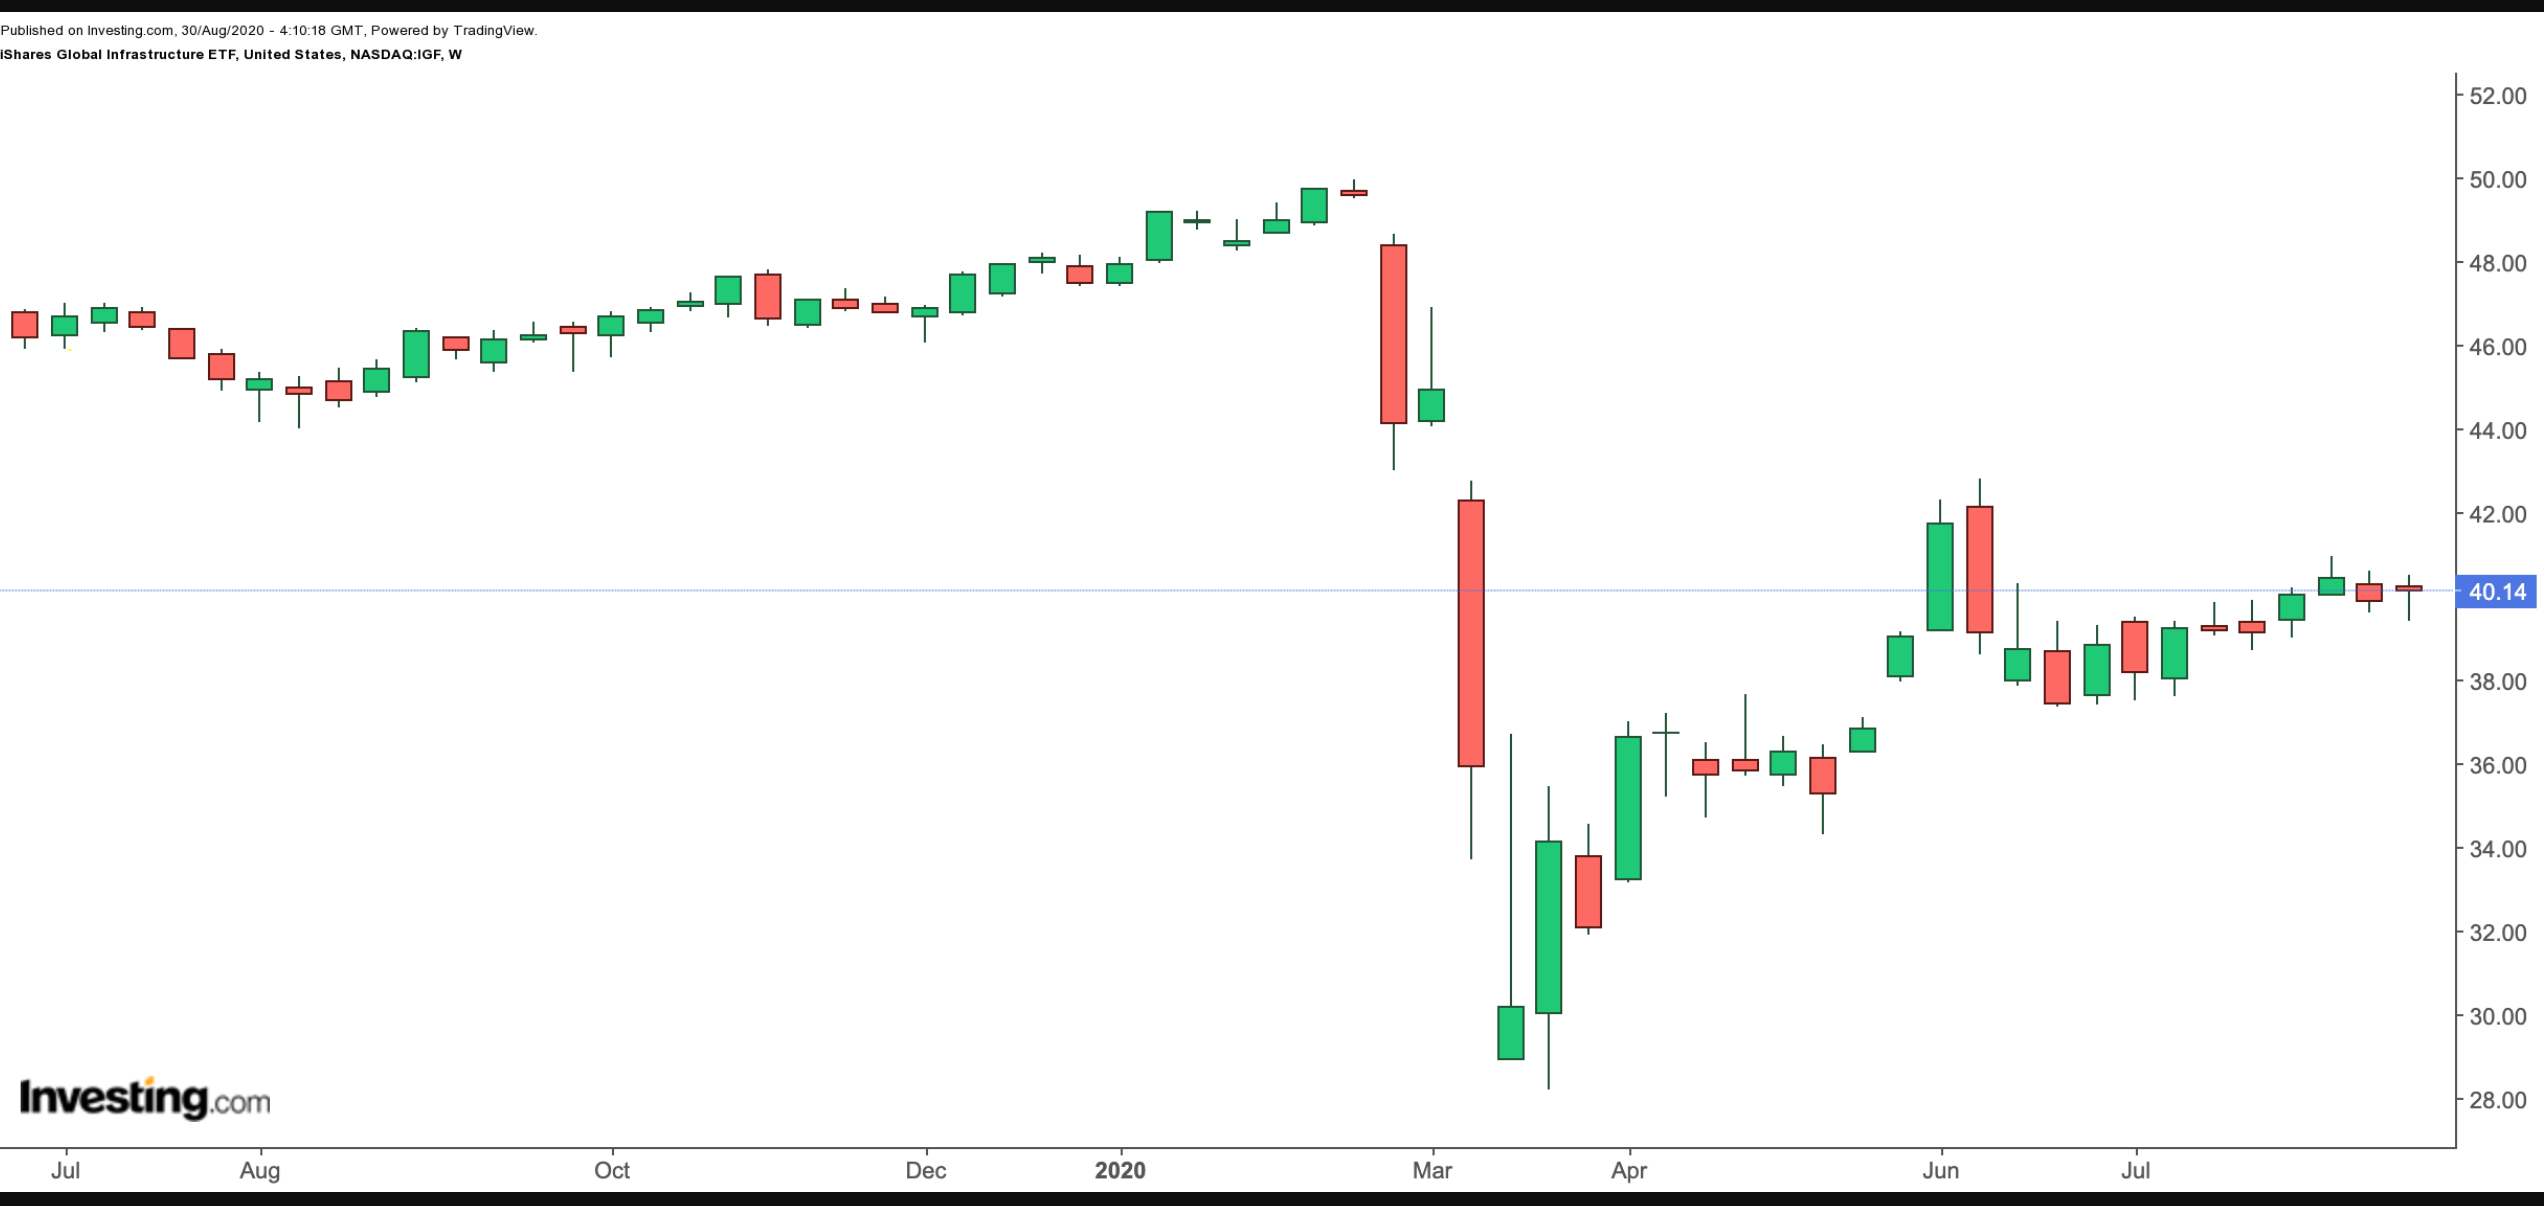
- Current Price: $40.14
- 52-week range: $28.19 – $49.93
- Dividend Yield: 3.04%
- Expense Ratio: 0.46 % per year, or $46 on a $10,000 investment

The iShares Global Infrastructure ETF (NASDAQ:IGF) provides exposure to companies that supply transportation, communication, water, and electricity services globally. IGF invests in infrastructure stocks from around the world, since in many countries growth in utilities is part of developing a region's infrastructure. The fund was launched in 2007.
IGF, which tracks the S&P Global Infrastructure index, has 75 holdings. The sector composition of the fund (by weighting) is Utilities (40.4%), Transportation (30.4%), and Energy (19.8%). The rest (0.40%) is Cash and Derivatives. Put another way, IGF provides utility exposure as part of a broader fund that also includes transportation and energy shares.
The top ten holdings make up approximately 40% of net assets, which are slightly over $3 billion. The fund's top five companies are NextEra Energy, Enbridge (NYSE:ENB) Aena SME (MC:AENA), Transurban Group (ASX:TCL) and TC Energy (NYSE:TRP).
In terms of geographic breakdown, the US (37.3%) tops the list, followed by Canada (11.1%), Australia (10.7%), Spain (8.4%), and Italy (7.9%).
Year-to-date, IGF is down 16.2%. This metric does not include its dividend payment. The trailing P/E and P/B ratios are 17.31 and 1.75, respectively. Long-term and contrarian investors may begin to find value if the price further dips toward the $37-level.
Bottom Line
While many stocks on Wall Street have recovered their losses since the March drop, investors are still uncertain about if the economy will truly make a full recovery. September may be an appropriate time for market participants to examine their portfolios to see whether they're built to withstand a potential contraction.
For those who believe we are entering a period of economic slowdown, utilities ETFs are worth considering.
