As west coast wildfires continue burning in the US and hurricane season ramps up, with hurricanes Sally, Isaias, Laura, Paulette, Alpha, Beta, Teddy and others already making headlines, the potential for massive amounts of damage is multifold. For those on the ground, loss of life, property and possessions are the most devastating aspects of such calamities.
From an economic perspective, there are various costs associated with such unforeseen events. According to United Policyholders (UP), a non-profit advocacy group, the recent wildfires will likely cost "insurers between $7.5 billion and $10 billion.” In the end, the total economic cost is likely to be a lot greater, given that the loss of human and animal life as well as the environmental impact.
Another enormous risk hitting the global economy: coronavirus. The worldwide pandemic has brought the importance of health insurance to the forefront.
With risk looming in an increasingly dangerous world, the demand for insurance is growing rapidly. And it's not just because of increased hazards from natural disasters and viruses, but also in developing countries with large and growing middle-class populations such as China.
For all these reasons, insurance companies are in the ideal position to benefit from growing demand for their services given the high-profit potential of their business models. Even with escalating risks, the majority of people paying insurance premiums rarely file claims, making the business model for insurance companies ever more profitable.
Today, we'll delve into the insurance industry from an investing standpoint and introduce two exchange-traded funds (ETFs) that should be on your radar:
Size Of The Industry
In 2018, net premiums written in the insurance industry in the US, the world’s biggest insurance market, totaled $1.22 trillion. However, over the past decade, China has “almost tripled its world market share. In contrast, the share of mature markets (North America, Western Europe and Japan) declined by around 14pp.”
The industry employs close to 3 million people stateside where there are about 6,000 insurance companies. Property/casualty (P/C) insurers—primarily auto, homeowners and commercial insurance—account for around 40% of the companies. Net premiums written for the sector totaled $618.0 billion in 2018.
As for the rest of the companies, Health insurers and life/annuity insurers make up 15% and 13%, respectively.
Life/annuity sub-sector consists of annuities, accident and health, and life insurance. However, there are also companies that specialize in health insurance.
Lloyd's of London, also known as Lloyd’s, is the world’s largest insurance and reinsurance market entity.
Liability-Driven Market
Like buying insurance, investing in the industry can seem daunting at times. It is important investors consider the different characteristics of the market. Insurance companies are part of the financial services industry. However, there are differences between them and, for example, banks because they have a set of future liabilities that they have to pay in the case of a qualifying insurance claim, making them liability-driven.
Also, insurance companies closely practice asset-liability management, which differs from asset-only management strategies that aim to minimize portfolio risk while maximizing returns.
Since insurers have to invest premiums conservatively so claims can be met easily when they are due, they invest in fixed-income securities, such as U.S. government bonds as well as AAA-rated bonds from large corporations. Interest rates, understandably affect the duration and maturities of the bonds in their portfolios.
Their choice of portfolio holdings may also depend on the insurance offered. For example, by definition, life insurers commit to payouts decades in the future. Although long-term liabilities also allow for longer investment horizons, a pandemic such as COVID-19 may directly affect their liabilities. Or if the bonds held in portfolios get downgraded, capital requirements for insurers may change, putting pressure on financial stability. As a result, insurer risk appetite as well as premium rates may be affected.
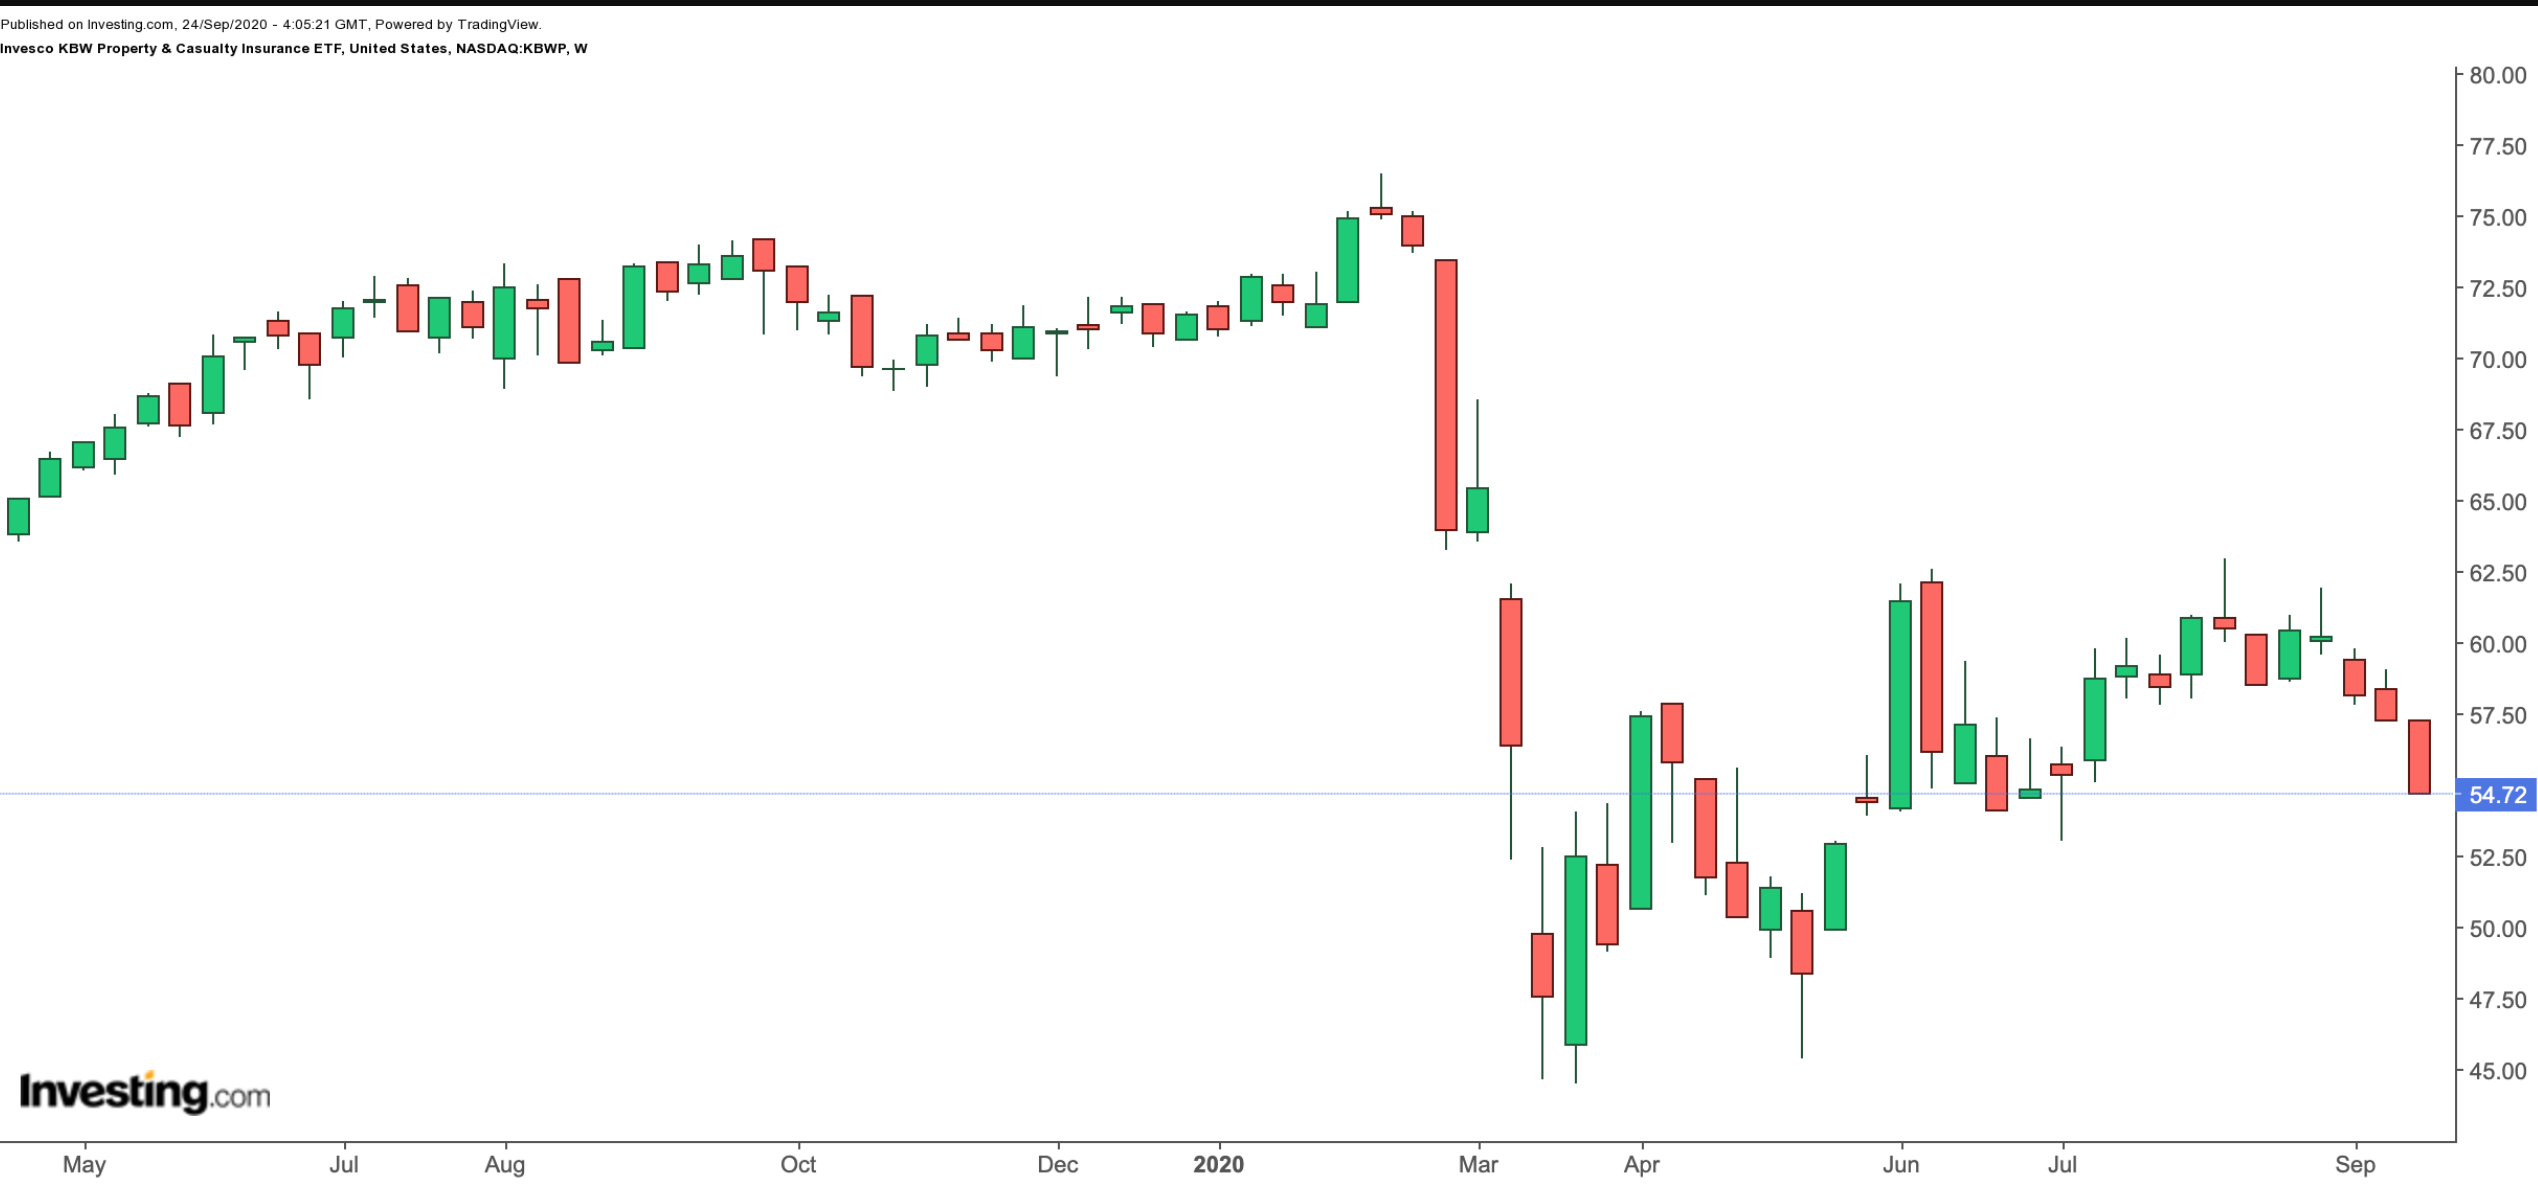
1. Invesco KBW Property & Casualty Insurance ETF
- Current price: $54.72
- 52-week range: $44.46 – $76.48
- Dividend Yield: 2.42%
- Expense ratio: 0.35%
The Invesco KBW Property & Casualty Insurance ETF (NASDAQ:KBWP) provides exposure to a range of property and casualty insurance companies.

KBWP, which has 24 holdings, follows the KBW NASDAQ Property & Casualty index. Since it is a modified market capitalization-weighted index, no holding makes up more than 9% of assets.
The top ten names compose about 60% of the fund. Progressive (NYSE:PGR), Allstate (NYSE:ALL), Travelers Companies, (NYSE:TRV), Chubb (NYSE:CB) 8.02% and American International Group (NYSE:AIG) lead the list of companies in KBWP.
In terms of sub-sectors, funds are distributed among Property & Casualty Insurance (69.6%), Multi-line Insurance (21.62%) and Reinsurance (8.78%).
Year-to-date, the fund is down about 22%. Trailing P/E and P/B ratios stand at 12.72 and 1.05. Contrarian investors who are also looking for value may want to put KBWP on their shopping list. As part of portfolio diversification, we'd consider buying the dips.
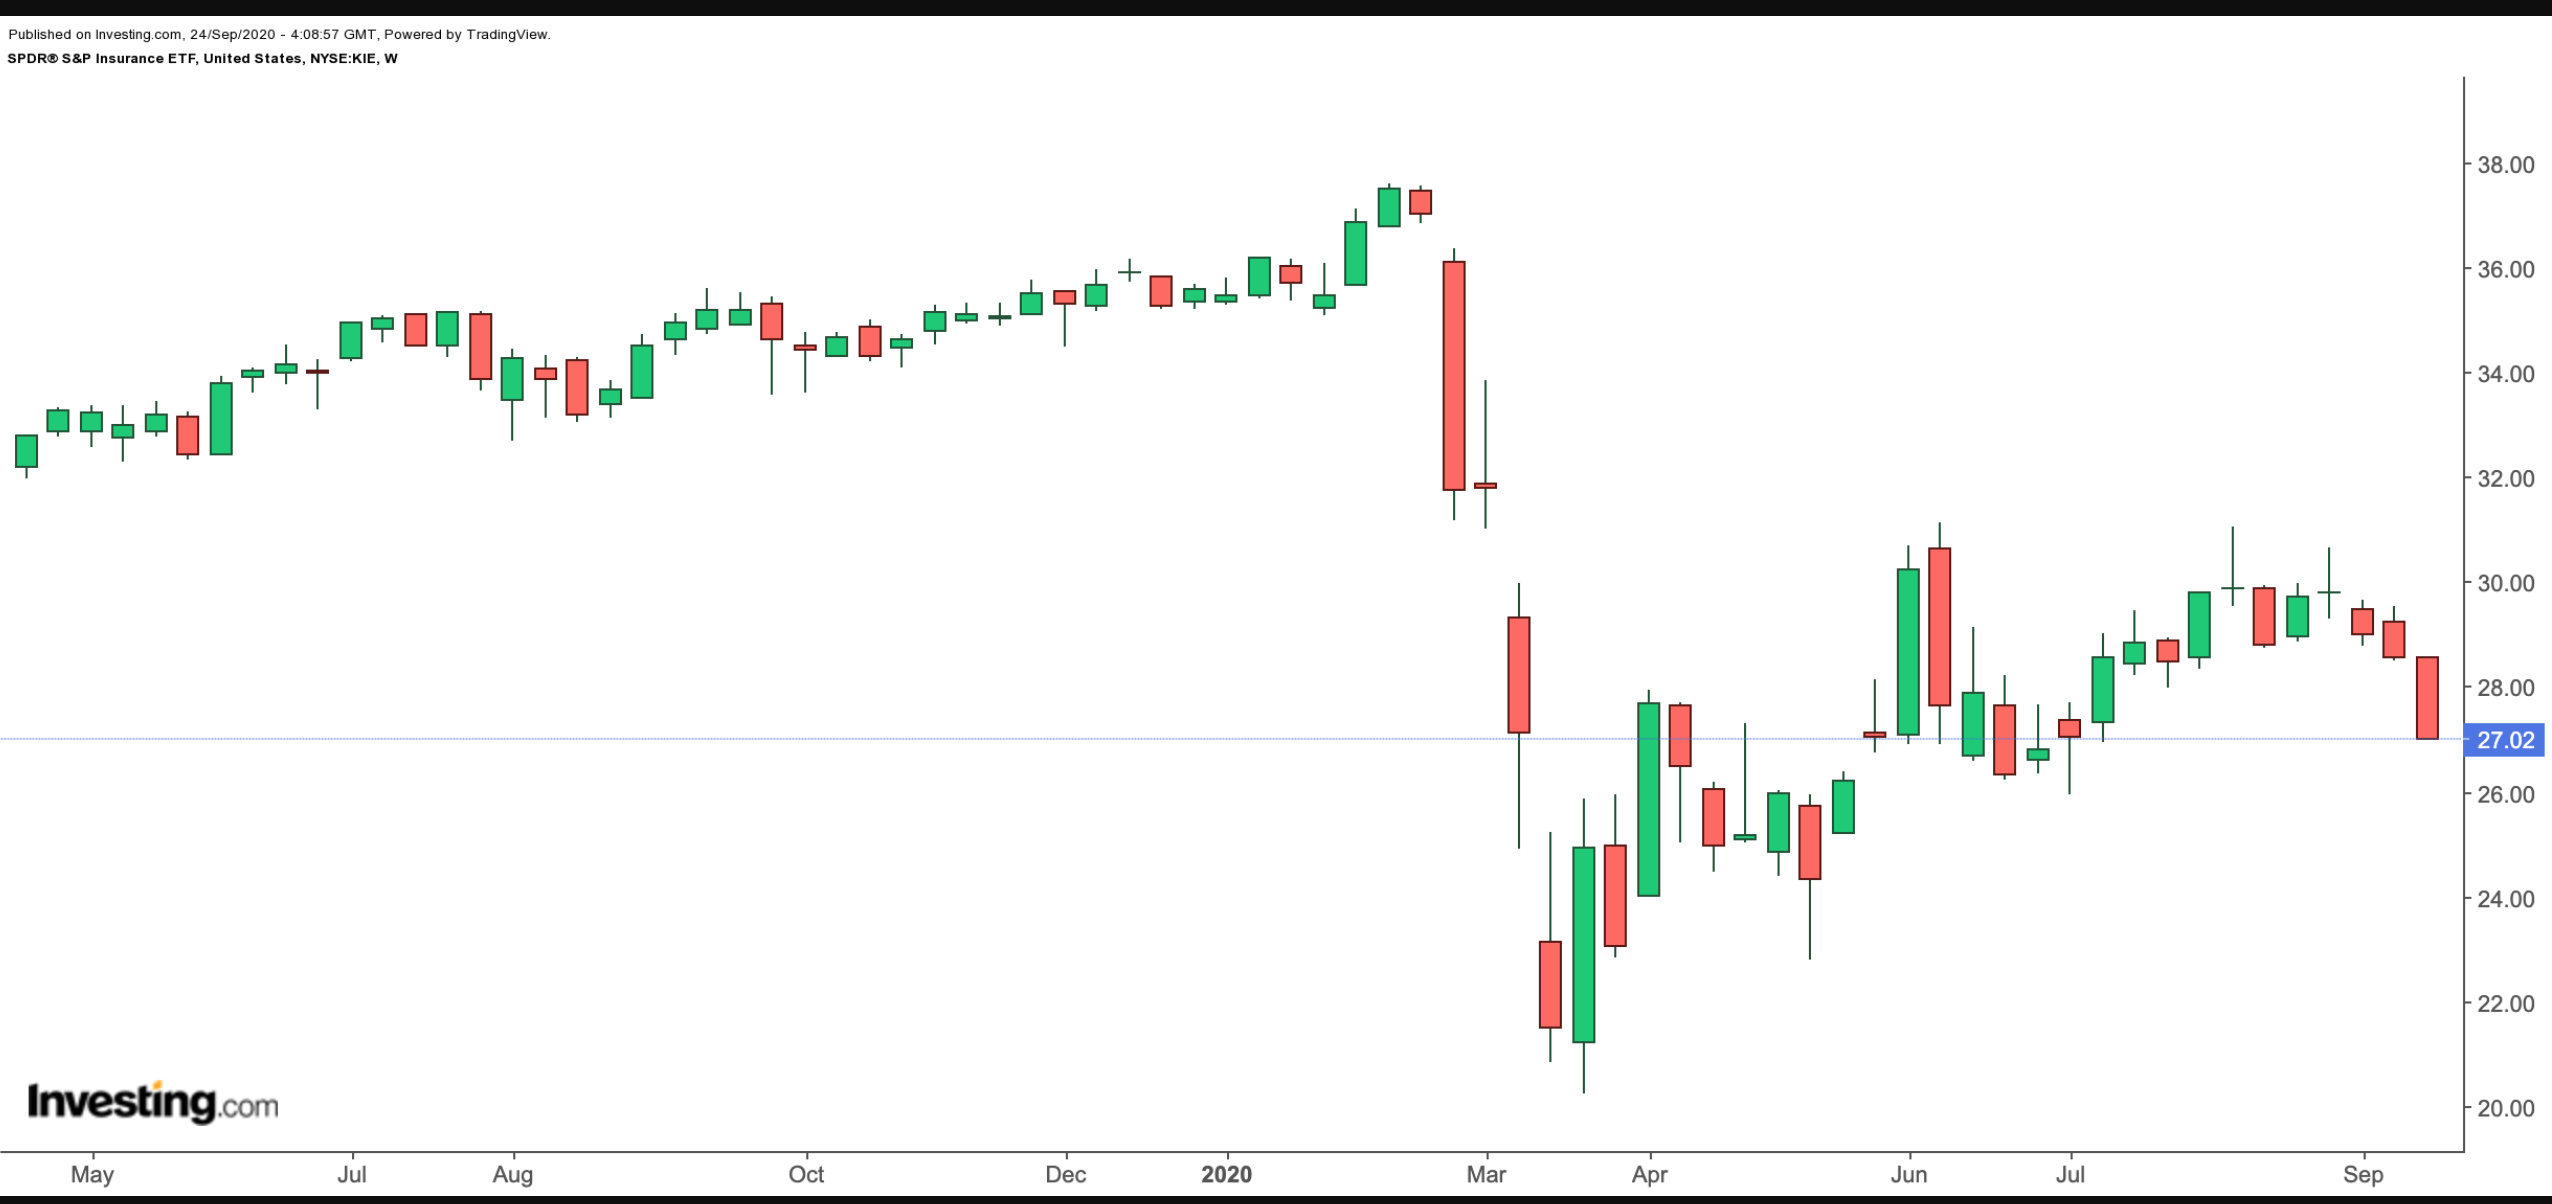
2. SPDR S&P Insurance ETF
- Current price: $27.02
- 52-week range: $20.23 – $37.57
- Dividend yield: 2.77%
- Expense ratio: 0.35%
The S&P Insurance ETF (NYSE:KIE) gives exposure to a wide range of insurance companies.

KIE, which has 50 holdings, follows the KBW Insurance index. The top 10 companies comprise about 22% of assets under management which stands at $502 million. Put another way, regardless of market-capitalization, companies are equally-weighted in the portfolio, each has a weighting of around 2%.
eHealth (NASDAQ:EHTH), Arthur J Gallagher & Co (NYSE:AJG), Assurant (NYSE:NYSE:AIZ) and Marsh & McLennan Companies (NYSE:MMC) are the top five names in the fund. The sub-sectors include Property & Casualty Insurance (43.24%), Life & Health Insurance (25.01%), Insurance Brokers (13.70%), Reinsurance (9.30%) and Multi-Line Insurance (8.74%).
The allocation shows that the fund invests in any businesses that has an insurance component, including insurance brokers. Investors should ideally review their investment objectives to see if they would like this kind of diversification.
Since the beginning of the year, the fund has also fallen by 22%. As a result, trailing P/E and P/B ratios stand at 10.88 and 0.72, respectively. We believe the fund offers value around these levels.
