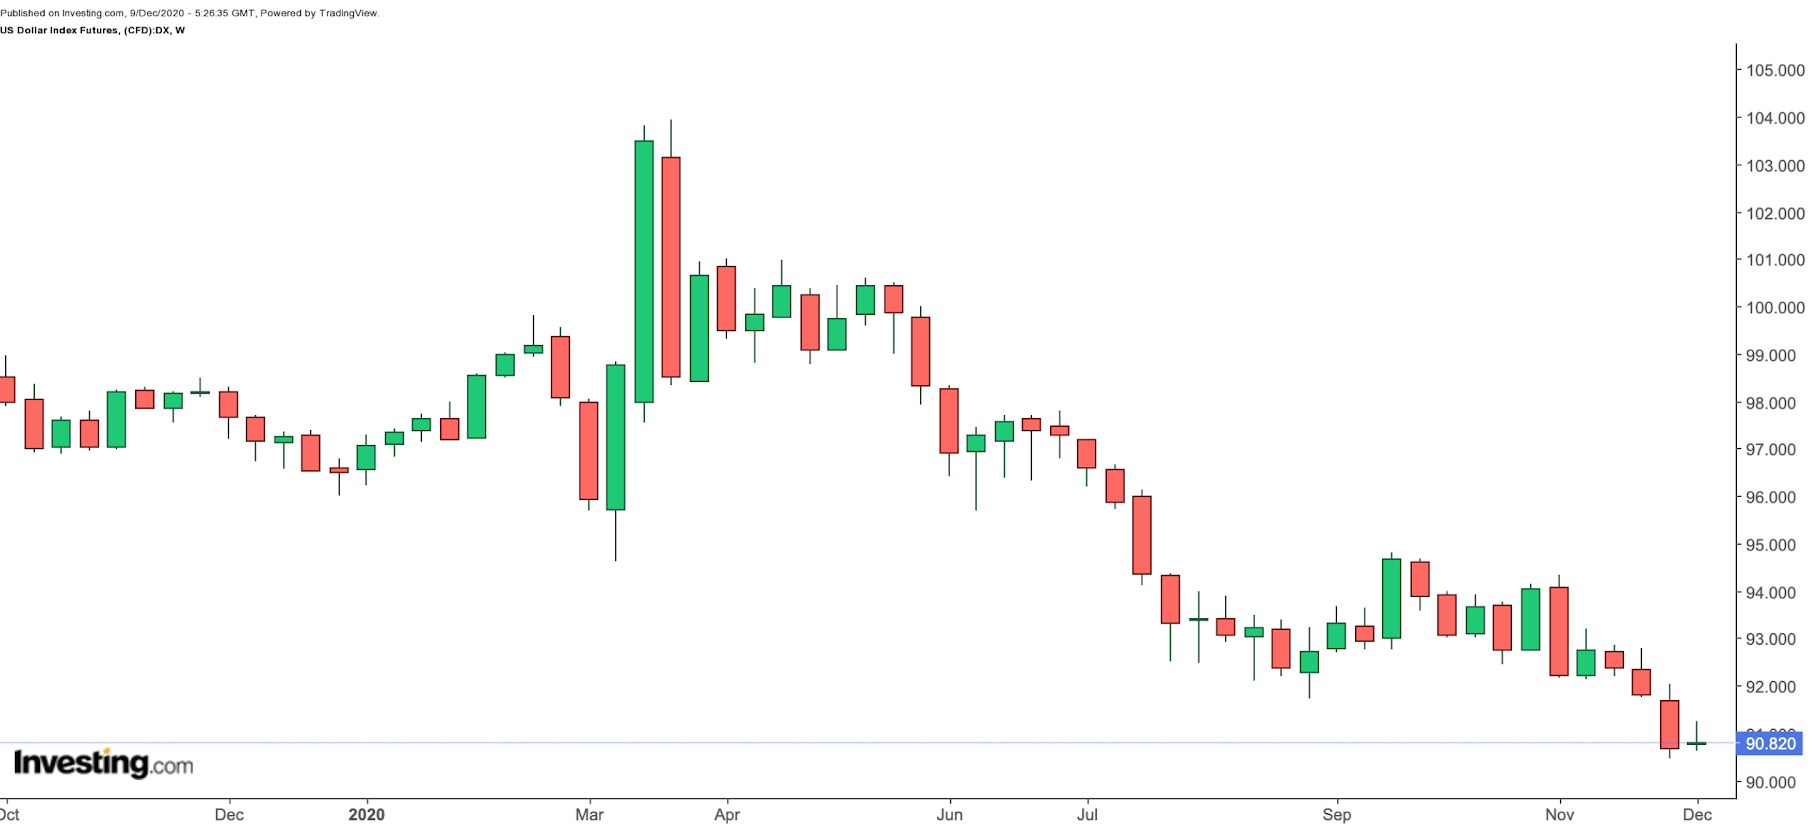
The U.S. dollar has been on bearish footing against a wide range of currencies. November was a difficult month for the greenback, and December is not providing much relief, either.
Vaccine cheer worldwide, a clear Biden victory, and the increasing prospects for another U.S. stimulus package have led to a rush into riskier assets. Many now wonder whether the U.S. Dollar Index will break down below the $90 level.

We previously discussed how moves}} in the dollar could affect equity returns overseas for U.S.-based investors. A potential decline in USD typically benefits emerging market exchange-traded funds (ETFs).
Emerging market equities have mostly kept pace with broader U.S. markets. iShares MSCI Emerging Markets ETF (NYSE:EEM) for example, is up over 13% year to date after hitting a record high of $50.99 on Dec. 7. By comparison, the S&P 500 is about 17% in 2020.
According to the Journal of Wealth Management, investing in emerging-market ETFs in addition to iShares Core S&P 500 ETF (NYSE:{{518|IVV), a fund composed of established U.S. companies, "leads to higher absolute returns, better risk-adjusted performance (Sharpe and Omega ratios), higher cumulative returns, and increased wealth for U.S. investors. Results are statistically significant."
In the case of further USD weakness, emerging markets could reach fresh all-time highs.
With that in mind, here are two EM funds to consider as the U.S. Dollar Index weakens:
1. Schwab Emerging Markets Equity ETF
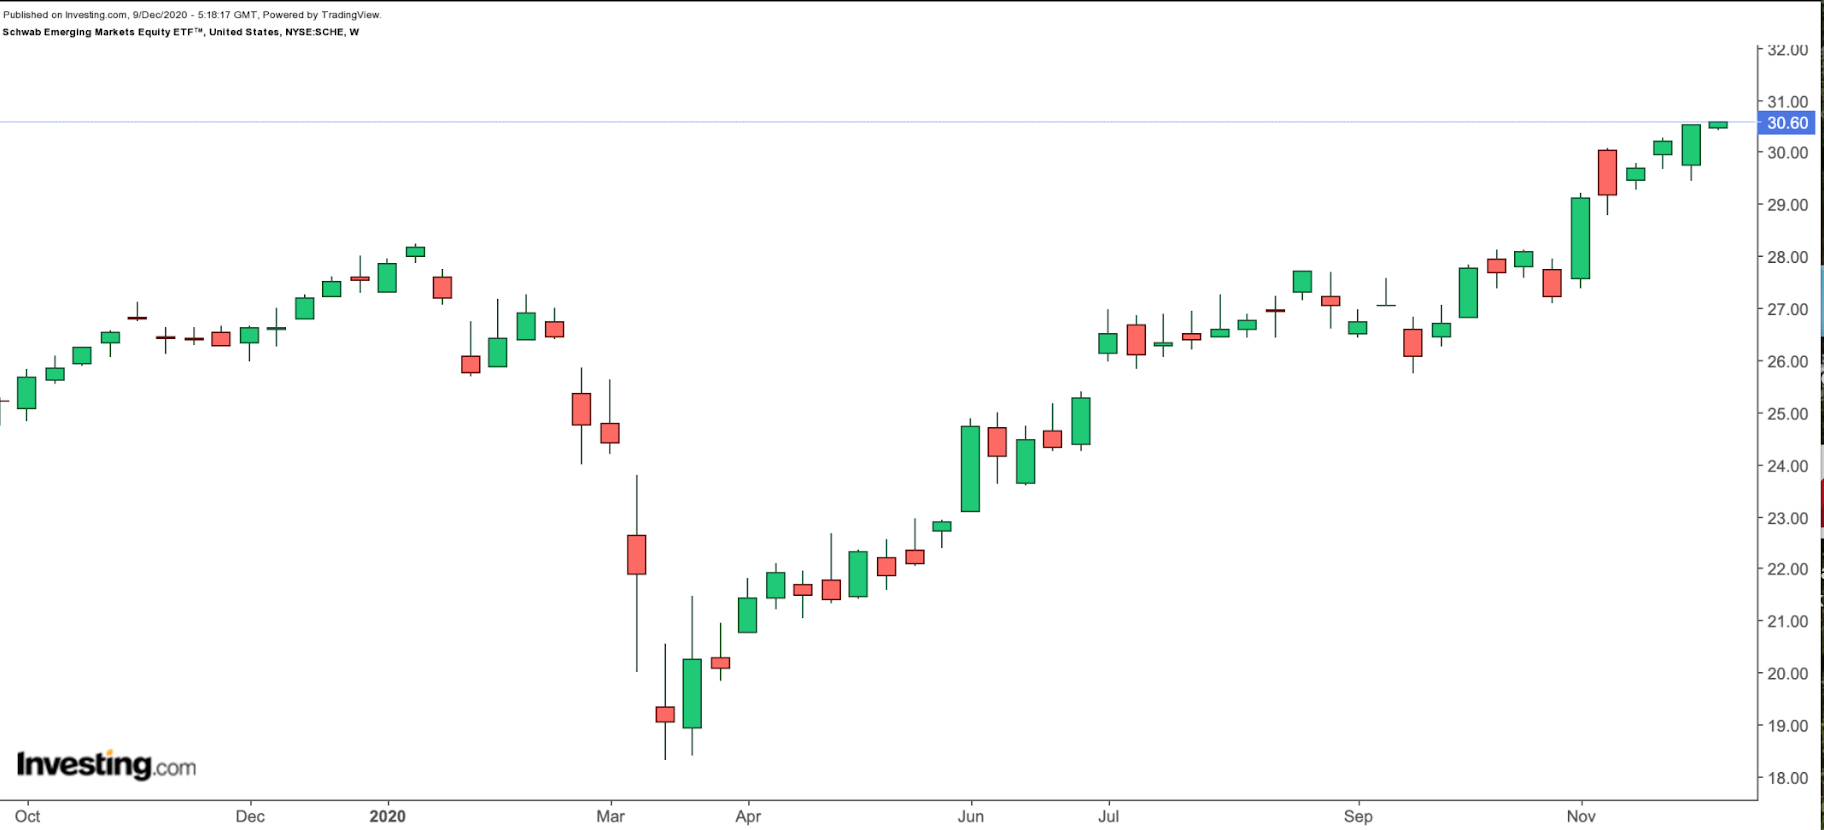
- Current Price: $30.60
- 52-Week Range: $18.32 - $30.60
- Dividend Yield: 2.76%
- Expense Ratio: 0.11%
The Schwab Emerging Markets Equity ETF (NYSE:SCHE) provides exposure to a range of large-cap and mid-cap emerging market firms. The fund started trading in January 2010.

SCHE, which tracks the FTSE Emerging Index, has 1540 holdings. The top ten stocks comprise around 28% of assets under management of $8.2 billion.
Chinese internet e-commerce giant Alibaba (HK:9988), (NYSE:BABA) and social media and entertainment heavyweight Tencent Holdings (HK:0700) (NYSE:TME), chip leader Taiwan Semiconductor (TWO:5425), (NYSE:TSM), China-based food delivery platform Meituan (HK:3690), (OTC:MPNGY) and South-Africa headquartered internet group Naspers (JO:NPNJn), (OTC:NPSNY) lead the names in the fund.
Over a dozen sectors are represented in the fund, including consumer discretionary (20.22%), financials (19.18%), information technology (14.42%), communication services (12.36%), materials (7.06%), and energy (6.14%), among others.
So far in the year, SCHE is up over 1% and hit a record high of $30.60 on Dec. 8. Trailing P/E and P/B ratios are 6.93 and 1.92. Given the recent run-up in prices, some of the fund's heavyweights could come under pressure short-term. Such a decline would offer a better entry point for long-term investors.
2. iShares MSCI Emerging Markets ex China ETF
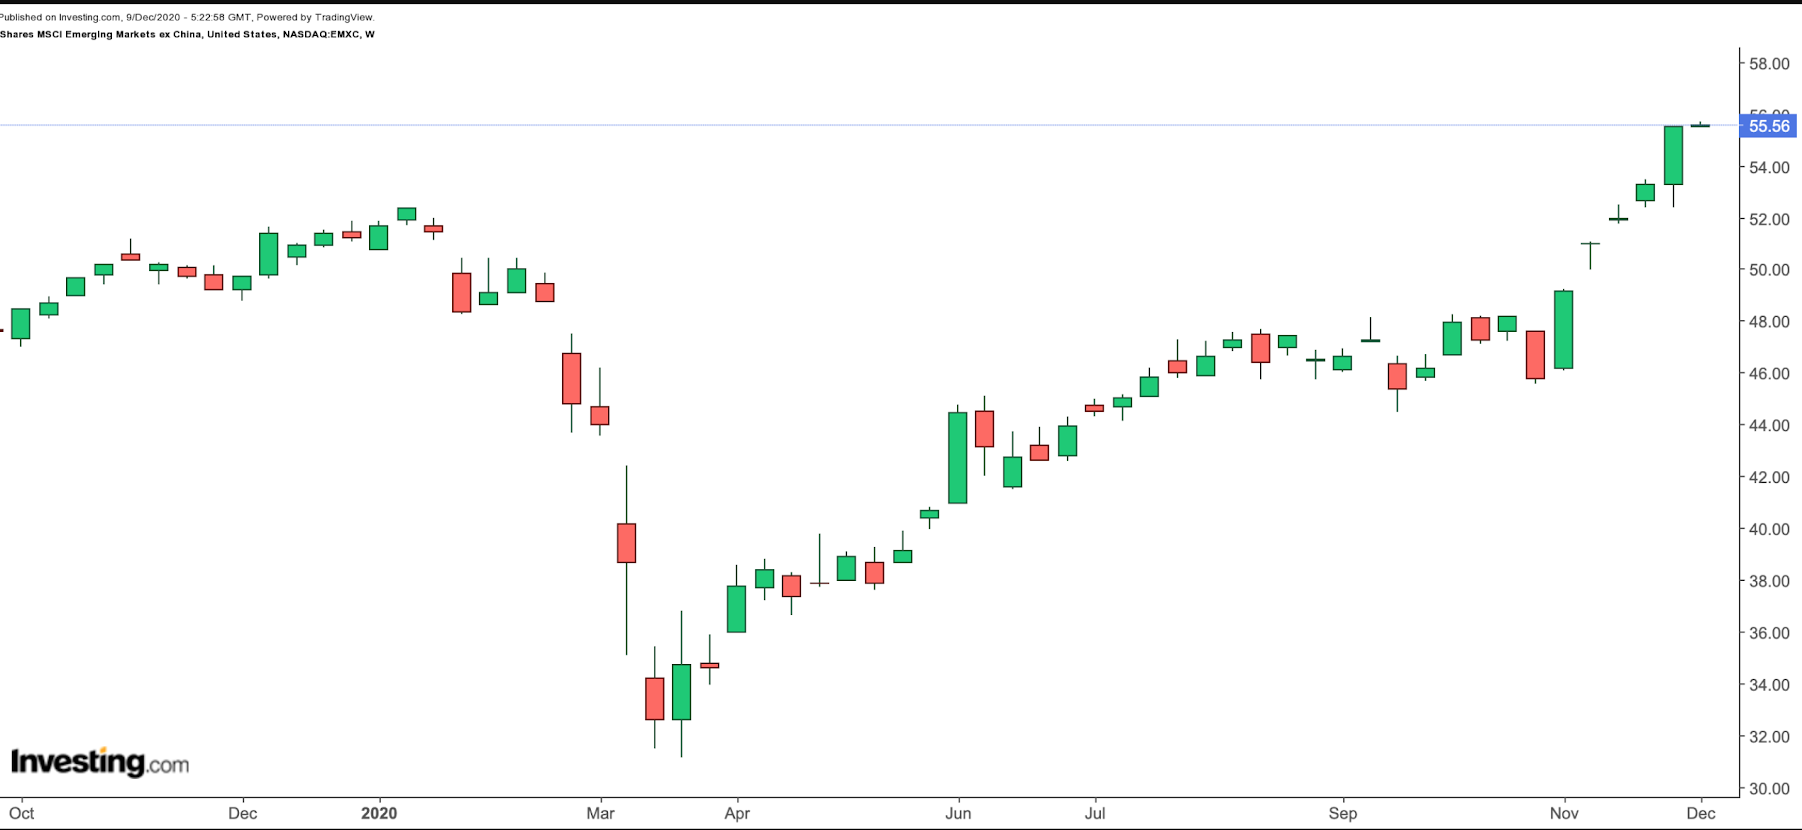
- Current Price: $55.56
- 52-Week Range: $31.17-55.82
- Dividend Yield: 2.98%
- Expense Ratio: 0.16%
iShares MSCI Emerging Markets ex China ETF (NASDAQ:EMXC) gives access to large- and mid-cap EM companies, excluding China. The fund started trading in August 2017 and net assets stand around $109 million.

EMXC, which has 530 holdings, tracks the MSCI Emerging Markets ex China Index. 21.78% of the businesses come from South Korea, followed by Taiwan (20.37%), India (14.76%), Brazil (8.29%), South Africa (5.69%), and Russian Federation (4.77%), among others.
iShares MSCI India ETF (NYSE:INDA), Taiwan-based Semiconductor (TWO:5425), (NYSE:TSM), South Korean chip giant Samsung (LON:0593xq) Electronics (KS:005930), (OTC:SSNLF), South Korean semiconductor group SK Hynix (KS:000660), and Naspers are the leading names in the ETF.
YTD, the fund is up 8.5% and also hit an all-time high in December. Trailing P/E and P/B ratios are 17.50 and 1.86. In the case of short-term profit-taking, long-term investors could look to enter the fund around $52.
Which stock should you buy in your very next trade?
With valuations skyrocketing in 2024, many investors are uneasy putting more money into stocks. Unsure where to invest next? Get access to our proven portfolios and discover high-potential opportunities.
In 2024 alone, ProPicks AI identified 2 stocks that surged over 150%, 4 additional stocks that leaped over 30%, and 3 more that climbed over 25%. That's an impressive track record.
With portfolios tailored for Dow stocks, S&P stocks, Tech stocks, and Mid Cap stocks, you can explore various wealth-building strategies.
