Benzinga - A positive week is coming to a close for the stock market ahead of Monday’s the Juneteenth holiday, with the S&P 500 Index up about 3% on the week, marking its fifth consecutive week in the green and its best weekly performance since the end of March. The week was defined by the Federal Reserve’s decision to hold interest rates steady, pausing its 15-month hiking cycle.
Unlike previous weeks, when the market surge was centered in a handful of mega-cap tech firms and AI-related stocks, the market’s breadth improved this week as more equities joined the rally.
S&P 500 Index: Key Highlights For The Week
- Only 75 of the 500 components of the S&P 500 ETF Trust (NYSE:SPY) are set to conclude the week in the red.
- Only two S&P 500 stocks lost more than 10% this week.
- Only 36 of the S&P 500 stocks have a negative month-to-date return in June.
- Only 1 out of 11 S&P 500 sectors is negative for the week – the Energy Select Sector SPDR Fund (NYSE:XLE), down by a mere 0.3%.
- The Invesco S&P 500 Equal Weight ETF (NYSE:RSP) rose 2.6% this week, the best performance since the end of March.
- The percentage of S&P 500 stocks trading above their 20-day moving average surged to 89%, approaching the high of 90% in the first week of April 2023.
- The percentage of S&P 500 stocks trading above their 50-day moving average has risen to 68%, the highest level since mid-February.
The Top 5 Performing S&P 500 Stocks For The Week
5) Catalent Inc (NYSE:CTLT)- Catalent rose 14.3% and was the fifth top performer among S&P 500 stocks during the week ending June 16.
- Catalent is up 19% in June but down 1.5% year to date.
- The stock’s share price is still 69% lower from September 2021’s highs.
- The pharmaceutical company is trading at a 65.9x forward P/E ratio, well above the median S&P 500 company (18.3x).
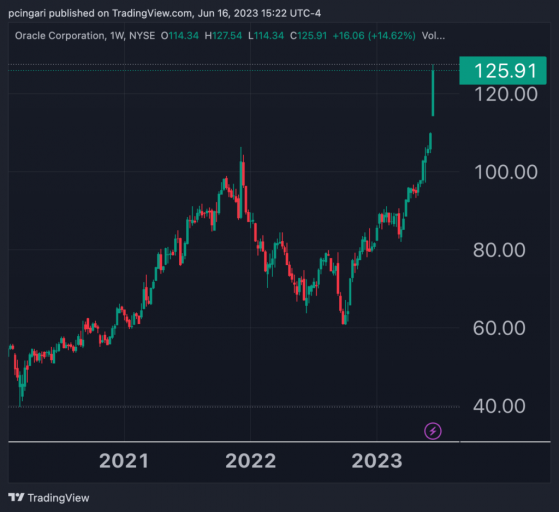
4) Oracle Corporation (NYSE:ORCL)
- Oracle Corporation rose 14.4% and was the fourth top performer among S&P 500 stocks during the week ending June 16.
- The stock’s share price reached an all-time high of $127.65 per share on June 15, 2023.
- Oracle’s gains were supported by the strong AI rally trend, with investors flocking to tech firms that had trailed in 2023.
- Oracle is up 18.6% in June and 53.7% year to date.
- The software company is trading at a 22.7x forward P/E ratio, which is higher than the median S&P 500 company (18.3x).
3) The Estée Lauder Companies Inc (NYSE:EL)
- Estée Lauder jumped 15.3% and was the third best performing stock for the S&P 500 during the week ending June 16.
- Estée Lauder is up 10.6% in June and 20.3% year to date.
- The stock’s share price is about 45% lower from its all-time high of $374 per share, which was hit in January 2022.
- The personal-care-product company shows a 45.87x forward P/E ratio, which is well above the median S&P 500 company (18.3x).
- Intel Corporation rose 16.4% and was the second best performer among S&P 500 stocks during the week ending June 16.
- Like Oracle, Intel’s gains were fueled by the continuing AI-related rally, with investors flocking to firms that had lagged in gains thus far.
- Intel is up 16% in June and 38% year to date.
- The semiconductor company is trading at a 47.9x forward P/E ratio, which is higher than the median S&P 500 company (18.3x).
- Carnival Corp. rose 20% and marked the best weekly return among S&P 500 stocks for the week ending June 16.
- On Friday, shares of Carnival Corp. briefly rose to their highest level since May 2022, before retracing and ending the session in the red.
- Carnival is up 39.8% thus far in June and 95% year to date.
- The stock’s share price is still about 70% below its January 2020 level.
- The cruise company is trading at a 67x forward P/E ratio, which is higher than the median S&P 500 company (18.3x).
Chart: Carnival Still Trades About 70% Lower Its Pre-Covid Levels
Now Read: Benzinga’s ‘Stock Whisper’ Index: 5 Stocks Investors Are Secretly Monitoring But Not Talking About Yet
Photo: Shutterstock
© 2023 Benzinga.com. Benzinga does not provide investment advice. All rights reserved.
Read the original article on Benzinga
