Benzinga - Tesla Inc. (NASDAQ:TSLA) had a tumultuous week. The company’s shares are down 1.3% for the week and suffering huge daily swings, ending a positive cycle of five straight weeks of increases — similar to what happened to the S&P 500 index.
Tesla, Microsoft Corp. (NASDAQ:MSFT), and Netflix Inc. (NASDAQ:NFLX) were the week’s underperformers among the U.S. mega-cap tech stocks that constitute the SPDR S&P 500 ETF Trust (NYSE:SPY).
Some technical signals have attracted our attention in Tesla’s weekly chart.
Tesla Inc.’s Weekly Chart: Bulls’ Rally Struck At The Major Bearish Trend Line
TSLA Technical Analysis: How The Sentiment Flipped This Week
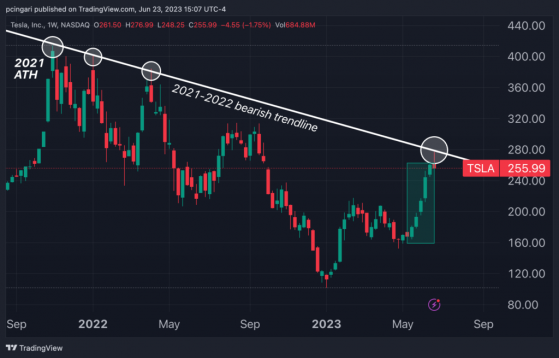
Tesla shares hit an intraweek high of $279 on Wednesday, but then struck at the dynamic resistance provided by the long-term bearish trend line that links the all-time highs from November 2021 to the lower highs from January and April 2022.A red weekly candlestick formed, halting a five-week winning streak in green, and the failure to overcome the 2021 negative trend line effectively represents a setback for bulls, fueling the resurgence of downside pressures.
After gaining more than 150% from its January 2023 lows, bulls that have joined the strong rally may now start to take a more cautious stance on the EV maker and begin reaping the hefty profits.
TSLA Key Support Levels To Watch Next
A trend reversal signal appeared on Wednesday, as the daily bearish candlestick completely engulfed the preceding Tuesday’s bullish candlestick.
This price movement negated bulls’ attempts to break above the 2021 trend line. It might potentially lead to further downside on Tesla.
The daily RSI indicator on Tesla at severely overbought levels (89) on Tuesday. That’s the highest since November 2021, before trending lower, signaling that the bulls’ momentum has effectively faded.
The next price support is placed around $235 — the 23.6% Fibonacci retracement level of the range from high to low in 2023. This level also represents the close of June 8, before Tesla spiked higher.
What’s attractive for bears is the $190-$200 range. It’s backed by multiple supports: the lows of June 2023, the 50-day and 200-day moving averages, and the 50% Fibonacci retracement level of the 2023 rally.
That would entail a decline of almost 30% from June highs, which would be an intriguing dip to reassess the conviction of buyers.
Now Read: Bitcoin, Ether Cross Crucial Levels: ‘Building The Foundations For The Next Bull Cycle’
© 2023 Benzinga.com. Benzinga does not provide investment advice. All rights reserved.
Read the original article on Benzinga
Which stock should you buy in your very next trade?
AI computing powers are changing the stock market. Investing.com's ProPicks AI includes 6 winning stock portfolios chosen by our advanced AI. In 2024 alone, ProPicks AI identified 2 stocks that surged over 150%, 4 additional stocks that leaped over 30%, and 3 more that climbed over 25%. Which stock will be the next to soar?
Unlock ProPicks AI