Benzinga - by Piero Cingari, Benzinga Staff Writer.
In a month marked by volatility, the stock market is sending out distress signals like never before. The S&P 500 and Nasdaq 100 have both hit yearly lows in terms of the percentage of stocks trading below their 50-day moving averages.
The September market downturn is spreading like wildfire across various sectors, with only a handful of stocks managing to maintain the positive trend seen in recent months.
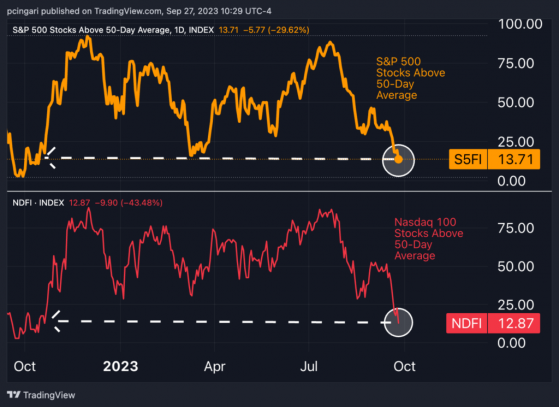
At present, only 13% of stocks included in the SPDR S&P 500 ETF Trust (NYSE:SPY), or 73 companies, are trading below the respective 50-day moving average. This percentage also holds true for the Nasdaq 100, marking the lowest value since late October 2020.
Chart: Percentage Of S&P 500, Nasdaq 100 Stocks Trading Above 50-Day Moving Average
Valero Energy Corporation (NYSE:VLO) and Amgen, Inc. (NASDAQ:AMGN) stand tall as they trade approximately 7.4% above their 50-day moving averages, the highest among S&P 500 stocks.
Conversely, Dollar General Corp. (NYSE:DG) and Insulet Corporation (NYSE:PODD) are noticeably lagging behind their historical performances, with declines of 27% and 23%, respectively, in comparison to the 50-day average. This positions them at the lower end of these statistical findings.
Shifting focus to the Invesco QQQ Trust (NYSE:QQQ), the largest ETF tracking the Nasdaq 100 Index, Amgen retains its leading position, followed by Seagen Inc. (NASDAQ:SGEN), which is trading 6% above its 50-day moving average.
On the downside, Illumina, Inc. (NASDAQ:ILMN) is trading by a significant 21% below the 50-day moving average, followed by Walgreens Boots Alliance Inc. (NASDAQ:WBA) at a 19% negative difference.
Read Also: US Households Have Depleted Their Pandemic Savings: Study Highlights Risk Of Economic Downturn
Energy Maintains Strong Breadth, Other Sectors Falter
Sectors with less than 10% of stocks trading below their moving averages include Utilities (6.7%), Consumer staples (5.3%), Industrials (5.3%), Consumer Discretionary (1.9%) and Real Estate (0.01%).
Above 50-Day Average
| S&P 500 | 13.7 |
| Energy | 47.8 |
| Financials | 25.0 |
| Health Care | 21.2 |
| Materials | 17.2 |
| Info & Tech | 10.8 |
| Utilities | 6.7 |
| Consumer Staples | 5.3 |
| Industrials | 5.3 |
| Consumer Discretionary | 1.9 |
| Real Estate | 0.01 |
Data: TradingView
Read Now: Lockheed Martin Faces Steepest Monthly Drop In 3 Years As Government Shutdown Looms
Photo: Unsplash
© 2023 Benzinga.com. Benzinga does not provide investment advice. All rights reserved.