Benzinga - NVIDIA Corp. (NASDAQ:NVDA) declined 1.74% on Wednesday, retracing somewhat after reaching new all-time highs of $440 per share on Tuesday. The price decline had little to do with company-specific factors, but rather with a deterioration in overall market risk sentiment on tech shares, with the Nasdaq 100 falling 1.35% and other tech titans all trading lower for the session.
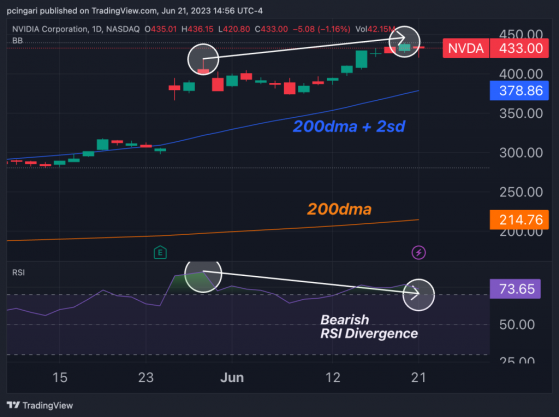
The daily Nvidia chart is beginning to display a bearish RSI divergence pattern, which might potentially signal a loss of upward momentum and potential reversal in the price trend.
As prices reached new all-time highs on Tuesday, the momentum indicator — the relative strength index or RSI — actually traded lower than previous highs established on May 30. The discrepancy between the rising price trend and the declining oscillator creates a negative divergence signal.
This could suggest the strong bullish momentum may have perhaps peaked, and that investors who have participated, entirely or partially, in the exorbitant 190% year-to-date rally made by Nvidia may be considering taking some profits.
Technically speaking, Nvidia shares continue to trade at extremely elevated levels, as they are about 100% higher than their 200-day moving average and 15% higher than two standard deviations from the 200-day moving average.
Nvidia Daily Chart: Bearish RSI Divergence Builds Up
Nvidia Stock Price: Key Levels To Watch
- Using Fibonacci retracement analysis, the 23.6% pullback from the highs of 2023 to the lows of 2023 corresponds to $369, or roughly 15% below current levels.
- This level represents the lows reached on May 25, when Nvidia stock soared 25% after the company’s earnings surpassed expectations.
- The 38.2% retracement from 2023 highs stands at $325, which would imply a 25% drop from current levels.
Read now: Cathie Wood Sells More Nvidia Shares After Rally: Here’s How Many Shares Ark Funds Owns Of AI Giant
© 2023 Benzinga.com. Benzinga does not provide investment advice. All rights reserved.
Read the original article on Benzinga
