Benzinga - by The Arora Report, Benzinga Contributor.
To gain an edge, this is what you need to know today.
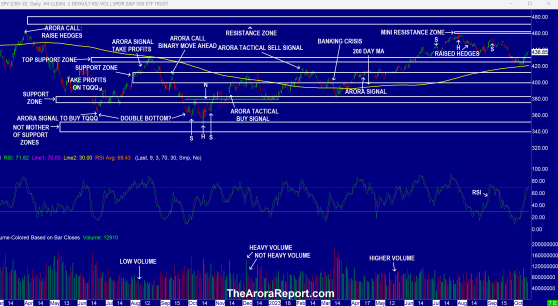
Hotter Consumer Inflation Please click here for a chart of SPDR S&P 500 ETF Trust (ARCA:SPY) which represents the benchmark stock market index S&P 500 (SPX).
Note the following:
- The chart shows that the stock market ran up above the top band of the top support zone in anticipation of better than expected Producer Price Index (PPI) and Consumer Price Index (CPI) as well as the market mechanics of year end chase and market positioning.
- Yesterday, we shared with you that PPI came hotter than expected, but bullish investors chose to ignore it. Please read yesterday’s Capsules for more on PPI. Bullish investors chose to pin their hopes on CPI coming better than expected and market mechanics.
- This morning, CPI came worse than expected. Here are the details:
- Headline CPI came at 0.4% vs. 0.3% month-over-month consensus.
- Core CPI came at 0.3% vs. 0.3% month-over-month consensus. Of special note is that the whisper numbers for Core CPI were 0.2%.
- Wall Street was positioned for 0.2% Core CPI.
- Now, there are two strikes against Wall Street positioning and bulls’ hopes in the form of PPI and CPI.
- Stock futures were running up ahead of the release of CPI on hopes of better than expected numbers. On release of CPI, the stock market took a slight dip. The momo crowd aggressively bought the dip and is trying to run up the stock market as of this writing.
- In The Arora Report analysis, even though progress is being made on inflation, core inflation is staying sticky, way above the Fed’s 2% target. This means that the Fed is likely to keep rates higher for longer but may be reluctant to raise rates. You may recall that The Arora Report’s call for a while has been that core inflation will stay sticky. So far, that call is spot on.
- Earnings season starts tomorrow, although a fair number of earnings were reported this morning. Earnings are expected to be inline with consensus; however, earnings this morning are mixed.
- Going forward, bulls’ faith in market mechanics to run up the stock market will be tested as their predictions on the data have been wrong.
- Here are the probabilities of Fed interest rate hikes:
- 10% in November
- 33% in December
- Initial jobless claims came at 209K vs. 214K consensus. This indicates that the job picture, especially at the low end, remains very strong. The job picture remains weak in information technology. During the pandemic, information technology had the strongest demand. Initial jobless claims are a leading indicator and carries heavy weight in our adaptive ZYX Asset Allocation Model with inputs in ten categories. In plain English, adaptiveness means that the model changes itself with market conditions. Please click here to see how this is achieved. One of the reasons behind The Arora Report’s unrivaled performance in both bull and bear markets is the adaptiveness of the model. Most models on Wall Street are static. They work for a while and then stop working when market conditions change.
- As an actionable item, the sum total of the foregoing is in the protection band, which strikes the optimum balance between various crosscurrents. Please scroll down to see the protection band.
In The Arora Report analysis, this is good news. However, even though India is the best large economy opportunity for long term investors, in the short term, India’s stock market is overbought and valuations are too high. If the Indian market dips, it will be a buying opportunity. To see the buy zone for India and The Arora Report’s short term, medium term, and long term ratings, please see ZYX Emerging. ZYX Emerging has continuously covered India for 16 years.
China China’s sovereign wealth fund, which is controlled by the Chinese government, bought more stock in China’s largest banks. As this has not happened since 2015, speculation is growing that the Chinese government will increase its efforts to help the Chinese stock market.
In The Arora Report analysis, this maneuver by the Chinese government will only have a limited impact on the stock market.
Magnificent Seven Money Flows In the early trade, money flows are positive in Apple Inc (NASDAQ: AAPL), Amazon.com, Inc. (NASDAQ: AMZN), Alphabet Inc Class C (NASDAQ: GOOG), Meta Platforms Inc (NASDAQ: META), and NVIDIA Corp (NASDAQ: NVDA).
In the early trade, money flows are negative in Microsoft Corp (NASDAQ: MSFT) and Tesla Inc (NASDAQ: TSLA).
In the early trade, money flows are mixed in SPDR S&P 500 ETF Trust and Invesco QQQ Trust Series 1 (NASDAQ: QQQ).
Momo Crowd And Smart Money In Stocks The momo crowd is buying stocks in the early trade. Smart money is