Benzinga - by Piero Cingari, Benzinga Staff Writer.
Energy commodities are experiencing a positive trading session around midday on Thursday, Aug. 24.
West Texas Intermediate (WTI) crude, as tracked by the United States Oil Fund ETF (NYSE:USO), oil is experiencing a slight uptick of 0.8%, rising above $79 per barrel. This rise follows a dip to its lowest point in a month earlier in the day and indicates a potential halt to its three-day decline.
Conversely, the Henry Hub natural gas, as tracked by the United States Natural Gas Fund LP (NYSE:UNG) showcased an impressive 3.5% surge, reaching $2.57 per MMBtu, rebounding after two straight sessions of declines.
What’s Driving Oil Prices Today?
On the front of crude oil, an interesting narrative unfolds as the BRICS nations undertake a strategic expansion of their coalition. The inclusion of new members, including heavyweight players such as Saudi Arabia, UAE, Argentina and Iran, has the potential to redefine the collective strategies and unity of emerging oil-producing countries.The U.S. has initiated discussions with Venezuela, hinting at the possibility of terminating commercial sanctions in exchange for upcoming democratic elections.
Meanwhile, recent economic data from the U.S. has stirred a mix of reactions. S&P Global’s Purchasing Managers’ Index (PMIs) for August has fallen short of expectations in both the manufacturing and services sectors. However, the surge in durable goods orders, excluding transportation, and the surprising drop in unemployment claims continue to keep recession fears at bay.
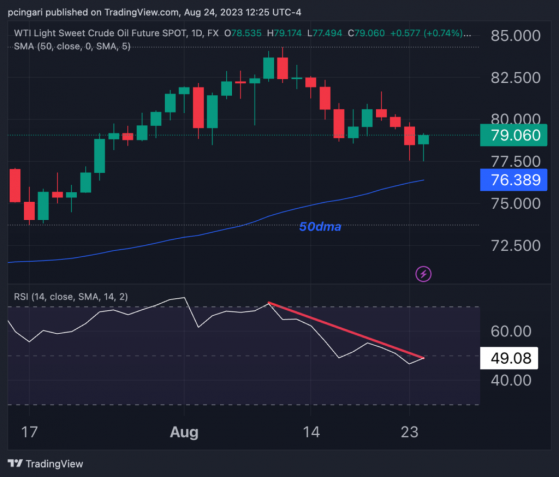
WTI Daily Chart
Crude oil WTI has continued to hold above its 50-day moving average since early July. However, the bullish momentum has recently taken a breather, as shown by the declining 14-day relative strength index (RSI).
The recent decrease in price, amounting to approximately 8% from the August peak, has led crude to dip below the significant threshold of $80.
Why is Natural Gas Rising Today?
Natural gas inventories have risen by 18 Bcf in the week concluding on Aug. 18, well below the projected 33 Bcf.The storage surplus has now contracted to single digits for the first time in several months, resting at a mere 9.5% above the norm.
Natural gas prices persist within the ascending channel initiated in April, yet they presently trade beneath the 50-day moving average. Despite this, prices have decreased by 15% from their August peak while still maintaining a 32% increase over April’s low point.
Natural Gas Daily Chart
Read More: The SPY Climbs Higher Ahead Of Jackson Hole Symposium: The Bull, Bear Case For The Stock Market
Photo: Shutterstock
© 2023 Benzinga.com. Benzinga does not provide investment advice. All rights reserved.
Read the original article on Benzinga
