Benzinga - by Surbhi Jain, .
Vertiv Holdings Co (NYSE:VRT) stock closed at $88, down by 9.35% on Thursday, but is trading in the green pre-market on Friday.
This brings the stock about 20% below the 52-week high of $109.27.
“Buy more Vertiv,” CNBC’s ‘Mad Money’ host Jim Cramer told his viewers. “I think the stock’s terrific.”
AI Infrastructure Stock Competing With Nvidia In Stock Surge Ohio-based Vertiv is a global provider of critical infrastructure and services for data centers, communication networks and commercial and industrial environments.
Vertiv is a high-momentum data center stock benefiting from significant investments by tech giants and the surge in AI data center buildouts.
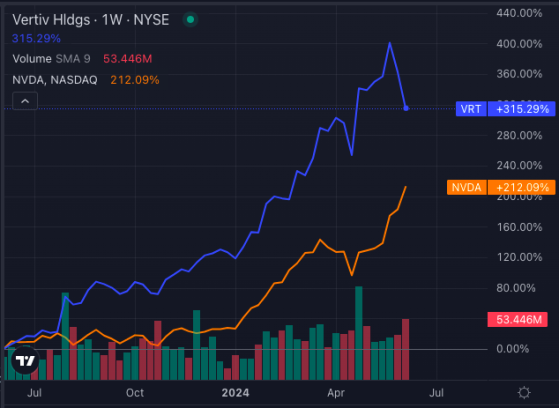
The stock has gained 315% over the past year, outperforming Nvidia Corp (NASDAQ:NVDA) which has gained 212% over the same period. However, YTD, the stock has gained 83.22% visavis Nvidia’s 144% surge.
Also Read: Nvidia Is Up 186% From A Year Ago, Yet These 7 Stocks Have More Than Doubled Their Returns Over The AI Chipmaker
Chart: Benzinga Pro
Robust Earnings, Positive Outlook On Liquid Cooling Demand Potential As of the last declared earnings, the company delivered a beat on both EPS and revenue estimates; delivering a surprise of 19.44% on earnings and 1.17% on revenue.
The company’s exponential growth in operating profit and free cash flow reflects its efficient absorption of positive industry trends and potential increase in liquid cooling demand.
The stock currently trades at a high forward price-to-earnings multiple of 36.88. However, Vertiv’s rapid scaling ability and growth potential appears to justify the current market optimism, as reflected in Cramer’s latest call on the stock.
Let’s see what the charts indicate for Vertiv stock ahead.
Vertiv Stock In Bearish Trend, Long-Term Indicators Bullish Vertiv stock is experiencing strong selling pressure, with its share price of $88 below its 5, 20, and 50-day exponential moving averages, indicating a bearish trend.
Chart: Benzinga Pro
The stock’s eight-day, 20-day, and 50-day simple moving averages also suggest a bearish signal. However, the 200-day simple moving average and the positive MACD indicator at 1.01 indicate potential buying opportunities.
The RSI at 40.84 is seen treading downwards suggesting the stock could soon enter the oversold territory – which could trigger a pull-back.
Overall, while short-term indicators are bearish, long-term indicators show signs are bullish.
Analysts See 23.48% Upside Potential Wall Street analysts appear to be bullish on the stock as well. The recent three analyst ratings for Vertiv stock released by Goldman Sachs, Bank of America Securities and Mizuho (April 26 onwards) have an average price target of $108.67 a share on the stock. This implies a potential upside of 23.48% for Vertiv stock from current price levels.
Though technicals indicate short-term bearishness, analysts and Cramer see the Vertiv as a terrific buy with promising returns.
Read Next: AI Boom: How Nvidia, AMD Growth Spurs Opportunities For Vertiv
© 2024 Benzinga.com. Benzinga does not provide investment advice. All rights reserved.
Read the original article on Benzinga
