Asia shares skid; oil climbs on Yemen escalation

Published 26/03/2015, 05:15
© Reuters. Pedestrians are reflected in the window of the Australian Securities Exchange next to a board displaying stock prices in central Sydney
XAU/USD
-
US500
-
DJI
-
AXJO
-
JP225
-
JPM
-
LCO
-
CL
-
US10YT=X
-
SSEC
-
MIAPJ0000PUS
-
USDIDX
-

By Wayne Cole

SYDNEY (Reuters) - Asian shares slipped on Thursday as tech-driven losses on Wall Street and escalating tensions in the Middle East provided a tailwind for oil prices and the safe haven yen.

Risk appetite took a knock from news Saudi Arabia and its Gulf Arab allies had launched air strikes in Yemen against Houthi fighters who have tightened their grip on the southern city of Aden.

The potential threat to oil supplies from the Gulf was enough to boost U.S. crude $1.81 to $51.02 (34 pounds), while Brent crude climbed $1.56 to $58.04 a barrel.

The dollar broke down to a one-month trough on the yen around 118.94 , while yields on 10-year U.S. Treasuries ticked down to 1.91 percent (US10YT=RR).

A dearth of Asian data meant the path of least resistance was for stocks to fall and MSCI's broadest index of Asia-Pacific shares outside Japan (MIAPJ0000PUS) eased 0.8 percent.

Australia's main index (AXJO) shed 1.4 percent, while the Nikkei (N225) lost 1.6 percent in its biggest daily decline since mid-January. Chinese markets, as so often, went their own way and Shanghai (SSEC) rose 0.5 percent.

On Wall Street, a drop in technology stocks had knocked the Nasdaq down 2.37 percent for its biggest decline in nearly a year. The Dow (DJI) fell 1.62 percent, while the S&P 500 (SPX) lost 1.46 percent.

Not helping was data showing spending on U.S. durable goods fell for a sixth straight month in February, fresh evidence that economic growth slowed sharply early in the year, due in part to bad weather.

That was just the latest in a run of soft U.S. indicators, a contrast to Europe where the news has been getting better.

JPMorgan (NYSE:JPM) noted that the gap between downward surprises on U.S. data and upward surprises on EU figures was at its widest since February last year when bad weather was also having a chilling effect on U.S. growth.

In currency markets, the dollar continued to drift after wild swings last week. Measured against a basket of currencies, the dollar eased 0.3 percent to 96.695 (DXY), just above a three-week trough of 96.387 set on Tuesday. Earlier this month, it scaled a 12-year peak of 100.390.

The euro was last at $1.0989, well off a 12-year trough of $1.0457 plumbed two weeks ago.

"While very tentative, the recent stability in the euro might suggest at least a near-term equilibrium has been reached," said CitiFX G10 strategist Josh O'Byrne.

"Though we still see EUR risks lower, we could be entering a period of consolidation," he said.
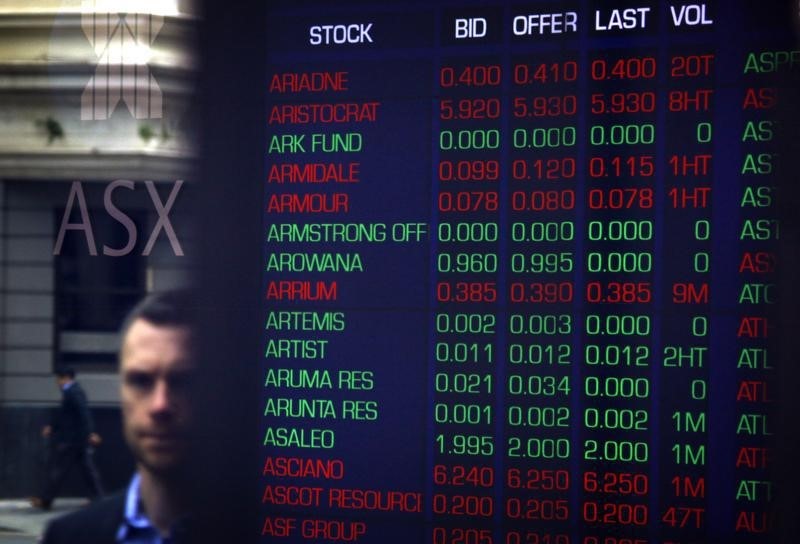
© Reuters. Pedestrians are reflected in the window of the Australian Securities Exchange next to a board displaying stock prices in central Sydney

The break the dollar uptrend has been a relief to some commodities and spot gold touched a three-week top around $2,000 an ounce .

Latest comments

Risk Disclosure: Trading in financial instruments and/or cryptocurrencies involves high risks including the risk of losing some, or all, of your investment amount, and may not be suitable for all investors. Prices of cryptocurrencies are extremely volatile and may be affected by external factors such as financial, regulatory or political events. Trading on margin increases the financial risks.
Before deciding to trade in financial instrument or cryptocurrencies you should be fully informed of the risks and costs associated with trading the financial markets, carefully consider your investment objectives, level of experience, and risk appetite, and seek professional advice where needed.
Fusion Media would like to remind you that the data contained in this website is not necessarily real-time nor accurate. The data and prices on the website are not necessarily provided by any market or exchange, but may be provided by market makers, and so prices may not be accurate and may differ from the actual price at any given market, meaning prices are indicative and not appropriate for trading purposes. Fusion Media and any provider of the data contained in this website will not accept liability for any loss or damage as a result of your trading, or your reliance on the information contained within this website.
It is prohibited to use, store, reproduce, display, modify, transmit or distribute the data contained in this website without the explicit prior written permission of Fusion Media and/or the data provider. All intellectual property rights are reserved by the providers and/or the exchange providing the data contained in this website.
Fusion Media may be compensated by the advertisers that appear on the website, based on your interaction with the advertisements or advertisers.
© 2007-2025 - Fusion Media Limited. All Rights Reserved.