By Jamie McGeever
LONDON (Reuters) - Good news for investors rattled by the "bear market" in many stock indices is that the selling may only last a few months --the bad news is that another big lurch lower is likely and that previous peaks will not be revisited for years.
Worries over China, collapsing oil prices and rising U.S. interest rates have pushed many European stock markets down more than 20 percent from highs hit last year, signifying losses of trillions of dollars for investors.
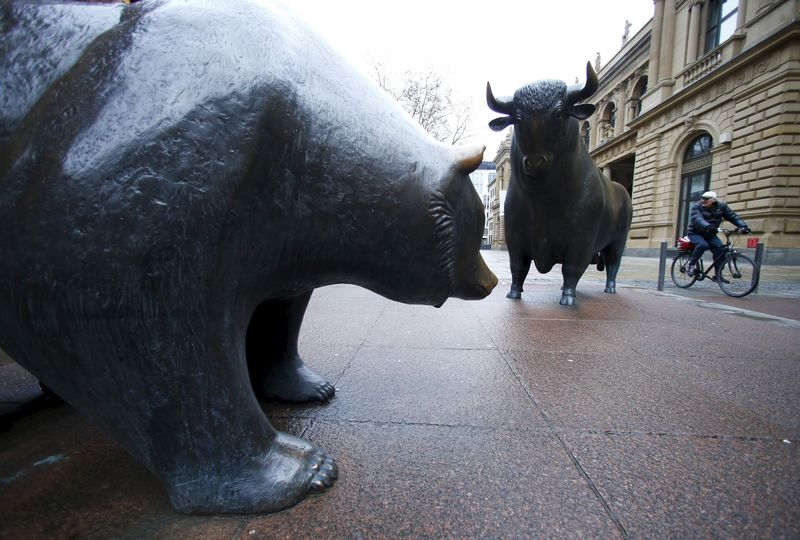
The slide has brought the term "bear market" back into public consciousness -- Google (O:GOOGL) searches for it this month are the highest since the depths of the Great Recession in October 2008 -- and raised the question, what comes next?
A Thomson Reuters analysis of the FTSEuroFirst 300 (FTEU3) shows there have been five previous bear markets since the index of leading European shares was launched in 1997, averaging 11 months' duration and with a peak-to-trough fall of 42 percent.
It took an average of 35 months once the cycle started to revisit the previous high, although the market has still not reached its all-time peak, hit in September 2000. The current bear market is nine months old and the index is down 24 percent.
Similar analysis of Britain's FTSE 100 (FTSE) shows seven previous bear markets since its launch in 1986, averaging 11.5 months with a peak-to-trough decline of 32 percent.
It took an average of 49 months once the downturn started to revisit the peak. Again, the current bear market is nine months old and the index is down 21 percent.
"The 20 percent pull-back level often acts as a short-term support level. But in true bear markets that gives way eventually, and when it does, the falls are dramatic," said Bill McNamara, technical analyst at Charles Stanley.
In a study of 43 bear markets around the world, analysts at Morgan Stanley (N:MS) concluded that the fall in Europe has further to go and that the Wall Street selloff "is the least advanced in magnitude and duration".
A bear market in the benchmark MSCI world index (MIWD00000PUS) is "well advanced" in terms of duration (90 percent of the median) and magnitude (65 percent of the median.
"If (the global index) followed the script precisely, it would imply 10 percent downside from current levels over the course of four weeks," they wrote in a note this week.
"WILD AND UNSUBSTANTIATED"
There is no specific reason why falls of 20 percent are called "bear markets", just as there's no real reason why the term "correction" is applied to declines of 10 percent. Barry Ritholtz, founder and chief investment officer of Ritholtz Wealth Management in New York, suggests "Why not?" is as good an explanation as any.
Dominic Wallington, chief investment officer at RBC Global Asset Management (UK) said financial markets are human constructs subject to human frailties and that bear markets bring out the behavioural traits of 'cognitive dissonance' in investors.
That is the unease an individual feels holding two or more contradictory ideas at the same time, doing something that goes against one or more of those beliefs, or when faced with new information that conflicts with these already-held views.
"They can do silly things," Wallington said. "What creates bear markets differs, but the process that investors go through is the same. You'll get denial because people think that the old paradigm holds."
Only time will tell if the current selloff accelerates or bottoms out relatively soon, and how shallow or rapid the recovery is.
Robert Kessler, founder and CEO of The Kessler Companies in Denver, says U.S. stocks are over-valued. He reckons S&P 500 company valuations as measured by their price/earnings ratio will fall further as credit markets continue to deteriorate.
The ratio is currently about 16 and could head below 10 for the first time in 33 years. "A single digit p/e would imply an S&P 500 below 1,109 -- a whopping 40 percent below current levels," Kessler said.
Barry Ritholtz is more open-minded. He notes that the S&P 500 has chalked up downward "corrections" of 10 percent or more once every two years on average since 1950, but those double-digit declines often end up being swept away by the following upswing. In more than half the years that saw 10 percent tumbles, the index actually finished higher, he said.
And since 1928, there have been at least 23 bear markets, or roughly one every 3 1/2 years, even though there have been long stretches -- such as 1946-1958 or 1988-1998 -- with no bear market at all.
"We don't know if this correction will be modest or significant, a full-blown bear market or worse," said Ritholtz.

"Lacking sufficient information to make an informed decision, I only suggest you don't make wild unsubstantiated guesses with your portfolios."