Benzinga - To gain an edge, this is what you need to know today.
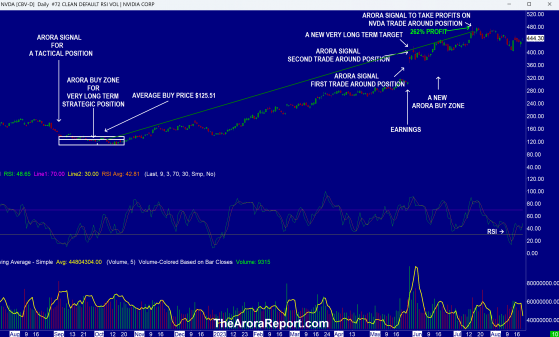
What Is Next Please click here for a chart of NVIDIA Corp (NASDAQ: NVDA).
Note the following:
- The Morning Capsule is about the big picture, not an individual stock. The chart of Nvidia stock is being used to illustrate the point.
- What happens next in the stock market will come down to Nvidia earnings and Powell’s speech at Jackson Hole.
- The chart shows when Nvidia earnings were last released. Nvidia guided current revenues to $11B from $7B for the quarter.
- The gap up shown on the chart added about $184B in market cap. This was the third largest market cap gain in one day in U.S. stock market history.
- Nvidia earnings accelerated the AI frenzy rally.
- The chart shows that there was a 262% gain in the Nvidia position if it was bought in the Arora buy zone shown on the chart.
- In addition, the trade around position in Nvidia has been nicely profitable. Trade around positions are a technique used by hedge funds and billionaires that can dramatically increase your returns and reduce your risks. To learn about trade around positions, please see the Trade Management Guidelines.
- In The Arora Report analysis, the demand for AI chips from Nvidia is far exceeding supply. As good as this sounds, the whisper numbers have moved up. Nvidia guided current quarter sales to $11B but whisper numbers are around $12B. A lot will also depend on what Nvidia guides for the current quarter that ends in October. Whisper numbers are around $12.5B.
- A major factor will also be what Nvidia guides for 2025.
- In The Arora Report analysis, if no other competition emerges, Nvidia will be looking at $18B in quarterly revenues. On the surface, Nvidia stock seems very expensive. It is trading at a forward PE of 42. However, in The Arora Report analysis, this PE can be justified based on the potential growth.
- Prudent investors should stick to the discipline of buying strategic positions in the buy zones and surrounding them with trade around positions as signals are given.
- Nvidia earnings are scheduled to be released on Wednesday after the close.
- Powell will be speaking at Jackson Hole on Friday.
- Bulls are hoping that he will say rate cuts are coming.
- Momo gurus are already laying the groundwork to twist his words to run up the stock market irrespective of what he says.
- In The Arora Report analysis, the highest probability is that Powell will say the Fed will be data dependent.
- As an actionable item, the sum total of the foregoing is in the protection band, which strikes the optimum balance between various crosscurrents. Please scroll down to see the protection band.
Magnificent Seven Money Flows In the early trade, money flows are positive in Apple Inc (NASDAQ: AAPL), Amazon.com, Inc. (NASDAQ: AMZN), Meta Platforms Inc (NASDAQ: META), Microsoft Corp (NASDAQ: MSFT), NVIDIA Corp (NASDAQ: NVDA), and Tesla Inc (NASDAQ: TSLA).
In the early trade, money flows are negative in Alphabet Inc Class C (NASDAQ: GOOG).
In the early trade, money flows are mixed in SPDR S&P 500 ETF Trust (ARCA:SPY) and Invesco QQQ Trust Series 1 (NASDAQ: QQQ).
China Interest rate cuts in China were less than expected. This caused a sell off in Shanghai and Hong Kong. Stocks in Mainland China were down 1.2% and stocks in Hong Kong were down 1.8%. The ETF of choice for Mainland China is Xtrackers Hvst CSI 300 China A-Shs ETF (ARCA: ASHR). The ETF of choice for Hong Kong is iShares China Large-Cap ETF (ARCA: FXI). ZYX Emerging from The Arora Report has covered China continuously for 16 years.
Momo Crowd And Smart Money In Stocks The momo crowd is buying stocks in the early trade. Smart money is inactive in the early trade.
Gold The momo crowd is buying gold in the early trade. Smart money is inactive in the early trade.
For longer-term, please see gold and silver ratings.
The most popular ETF for gold is SPDR Gold Trust (ARCA:GLD). The most popular ETF for silver is iShares Silver Trust (ARCA:SLV).
Oil The momo crowd is buying oil in the early trade. Smart money is inactive in the early trade.
For longer-term, please see oil ratings.
The most popular ETF for oil is United States Oil ETF (ARCA:USO).
Bitcoin Bitcoin (CRYPTO: BTC) is range bound.
Markets Our very, very short-term early stock market indicator is negative but expect the market to open higher. This indicator, with a great track record, is popular among long term investors to stay in tune with the market and among short term traders to independently undertake quick trades.
Protection Band And What To Do Now It is important for investors to look ahead and not in the rearview mirror.
Consider continuing to hold good, very long term, existing positions. Based on individual risk preference, consider holding