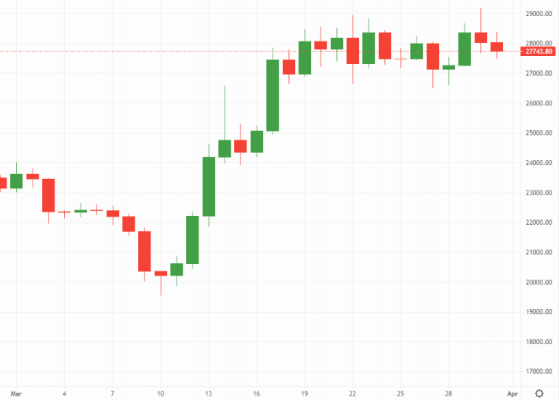
Proactive Investors - Here’s an interesting statistic: Bitcoin (BTC) has not seen two straight days of negative returns since March, the day the financial markets went into a post-SVB meltdown and investors rushed to their respective safe havens.
It speaks to the resilience of the benchmark cryptocurrency in recent weeks, in the face of banking collapses and intense regulatory crackdowns on fiat-to-crypto on-ramps.
But there are signs of this resilience coming to a halt, given how the BTC/USDT pair is currently changing hands 5% lower from yesterday’s intraday – nay, nine-month – high of US$29,184.
Worsening market liquidity conditions due to on-ramping constraints are contributing to an uptick in volatility, which seems to be favouring downside price action for the moment.
At the time of writing, bitcoin was changing hands for a flat US$27,800, wedged between a US$27,500 support line and US$29,000 resistance, per the Binance order book.
Bitcoin’s bullish March performance – Source: currency.com
The bulk of the price action over the past couple of weeks has been in the 26.5k to 28.5k range, which is where, optimistically speaking, BTC/USDT could persist.
Taking stock of the wider March picture, bitcoin’s performance has been undoubtedly marvellous, rallying over 4-0% since the March 10 safe-haven pivot, or 20% for the whole month; still a healthy sum.
Ethereum (ETH) is currently trading at US$1,800 on the ETH/BTC pair, marking 30% rally since the March 10 pivot and 12% for the whole month.
ETH's relative underperformance against bitcoin is evident when looking at the ETH/BTC trading pair, which fell around 7% for the month, primarily due to investors flocking to the relative stability of bitcoin.
Altcoins take the backseat
In an environment of extreme uncertainty such as the one we had in March, altcoins tend to fall out of favour, as has been the case this month.
Bitcoin dominance – a metric comparing the benchmark cryptocurrency’s market value to the entire crypto market, increased by over 7% throughout the month. It currently stands at over 47%.
As has been widely discussed already, Ripple (XRP) was the one altcoin to buck the trend. The payment closed March over 40% higher at US$0.53, spurred on by the perception that it is close to victory in the long-running dispute with the SEC.
In terms of overnight risers, alternative blockchains Hedera (HBAR), Stellar (XLM) and Casper (CSPR) topped the list while Flare (FLR) and Nexo (NEXO) saw the biggest losses among the top-100 set.
Global cryptocurrency market capitalisation dipped 1.8% to US$1.17tn overnight, while total value locked in the decentralised finance space dipped 0.4% to US$49.5bn.
Read more on Proactive Investors UK
