Benzinga - To gain an edge, this is what you need to know today.
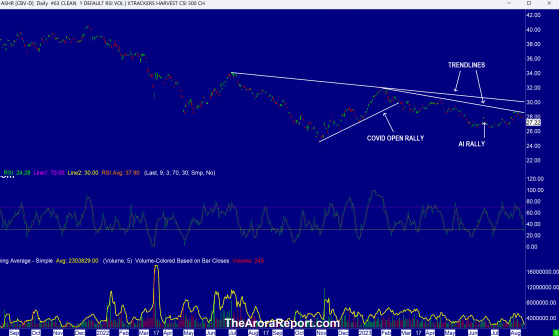
Hotter PPI Please click here for a chart of China ETF Xtrackers Hvst CSI 300 China A-Shs ETF (ARCA: ASHR).
Note the following:
- The Arora Report has been warning you for a while that the worsening relationship between the U.S. and China is a risk that long term, prudent investors need to take into account.
- Biden has soured the stock market sentiment by calling the Chinese economy a “ticking time bomb.” Biden also called the Communist Party’s leaders “bad folks.”
- Biden also jabbed China’s President Xi by calling his signature Belt and Road Initiative the “debt and noose.”
- The chart shows that unlike in the U.S., the AI rally in China did not sustain itself. Chinese companies are spending as heavily on AI as U.S. companies, but the AI frenzy has not taken hold among investors in China as it has among investors in the U.S.
- The chart shows the downward sloping trendlines in the Chinese stock market. In contrast, there are upward sloping trendlines in the U.S. stock market.
- Producer Price Index (PPI) came hotter than expected. Here are the details:
- Headline PPI came at 0.3% vs. 0.2% consensus.
- Core PPI came at 0.3% vs. 0.2% consensus.
- There were whisper numbers that core PPI would come below the consensus due to lower PPI in China. American producers are highly dependent on Chinese imports.
- In The Arora Report analysis, the rise in PPI runs counter to momo gurus’ bullish narrative that inflation is over and done with and the Fed is going to cut interest rates.
- Please click here for a chart of yesterday’s stock market price action. The price action shown on the chart is negative from a technical perspective. There is concern that the stock market in the U.S. ran up yesterday morning after the release of CPI but smart money sold into the strength generated by momo buying, causing a reversal. The sell off was aided by the poor Treasury auction. Please read the Afternoon Capsule for details.
- Investors may consider watching 7-10 year Treasury ETF iShares 7-10 Year Treasury Bond ETF (NASDAQ: IEF) and long bond Treasury ETF iShares 20 Plus Year Treasury Bond ETF (NASDAQ: TLT).
- As an actionable item, the sum total of the foregoing is in the protection band, which strikes the optimum balance between various crosscurrents. Please scroll down to see the protection band.
Magnificent Seven Money Flows In the early trade, money flows are negative in Amazon.com, Inc. (NASDAQ: AMZN), NVIDIA Corp (NASDAQ: NVDA), Microsoft Corp (NASDAQ: MSFT), Alphabet Inc Class C (NASDAQ: GOOG), Meta Platforms Inc (NASDAQ: META), Tesla Inc (NASDAQ: TSLA), and Apple Inc (NASDAQ: AAPL).
In the early trade, money flows are negative in SPDR S&P 500 ETF Trust (ARCA:SPY) and mixed in Invesco QQQ Trust Series 1 (NASDAQ: QQQ).
Momo Crowd And Smart Money In Stocks The momo crowd is buying stocks in the early trade. Smart money is selling stocks in the early trade.
Gold The momo crowd is buying gold in the early trade. Smart money is inactive in the early trade.
For longer-term, please see gold and silver ratings.
The most popular ETF for gold is SPDR Gold Trust (ARCA:GLD). The most popular ETF for silver is iShares Silver Trust (ARCA:SLV).
Oil The momo crowd is buying oil in the early trade. Smart money is inactive in the early trade.
For longer-term, please see oil ratings.
The most popular ETF for oil is United States Oil ETF (ARCA:USO).
Bitcoin Bitcoin (CRYPTO: BTC) is range bound.
Markets Our very, very short-term early stock market indicator is negative. This indicator, with a great track record, is popular among long term investors to stay in tune with the market and among short term traders to independently undertake quick trades.
Protection Band And What To Do Now It is important for investors to look ahead and not in the rearview mirror.
Consider continuing to hold good, very long term, existing positions. Based on individual risk preference, consider holding