This article was written exclusively for Investing.com
- Sugar rises to multi-year high
- Keep an eye on the Brazilian currency
- Energy prices are bullish for sugar
- Weather in Brazil is always a critical factor
- In a commodity bull market, sugar has explosive potential: An ETF and an ETN track the price of the soft commodity
Because many countries worldwide subsidize the production of sugar, it's a two-tiered market. World sugar that trades on the Intercontinental Exchange reflects the free market price of the soft commodity.
Brazil is the leading producer and exporter of sugarcane. Each year’s Brazilian crop is a critical factor for the path of least resistance of the sweet commodity’s price.
Since the early 1970s, world sugar futures have traded as low as 2.29 and as high as 66.0 cents per pound. I was a commodity option trader and market maker in the mid-1980s when the price of sugar reached its low. I was starting my career and pointed out the low price to the head options trader, suggesting that it could be a perfect opportunity for a long position. His answer was memorable:
“Why would I ever want to buy a product that restaurants give away for free?”
Meanwhile, the low for the agricultural commodity occurred in 1985. By 1986, sugar more than quadrupled in price, reaching a high of 9.58 cents per pound.
Sugar is not only a food ingredient, it is also the primary ingredient in ethenol in Brazil. Therefore, gasoline, biofuel, and currency levels impact sugar’s price. Now, in early 2021, sugar has broken out to a multi-year high, reaching 16.75 cents per pound on Jan. 14.
Sugar rises to multi-year high
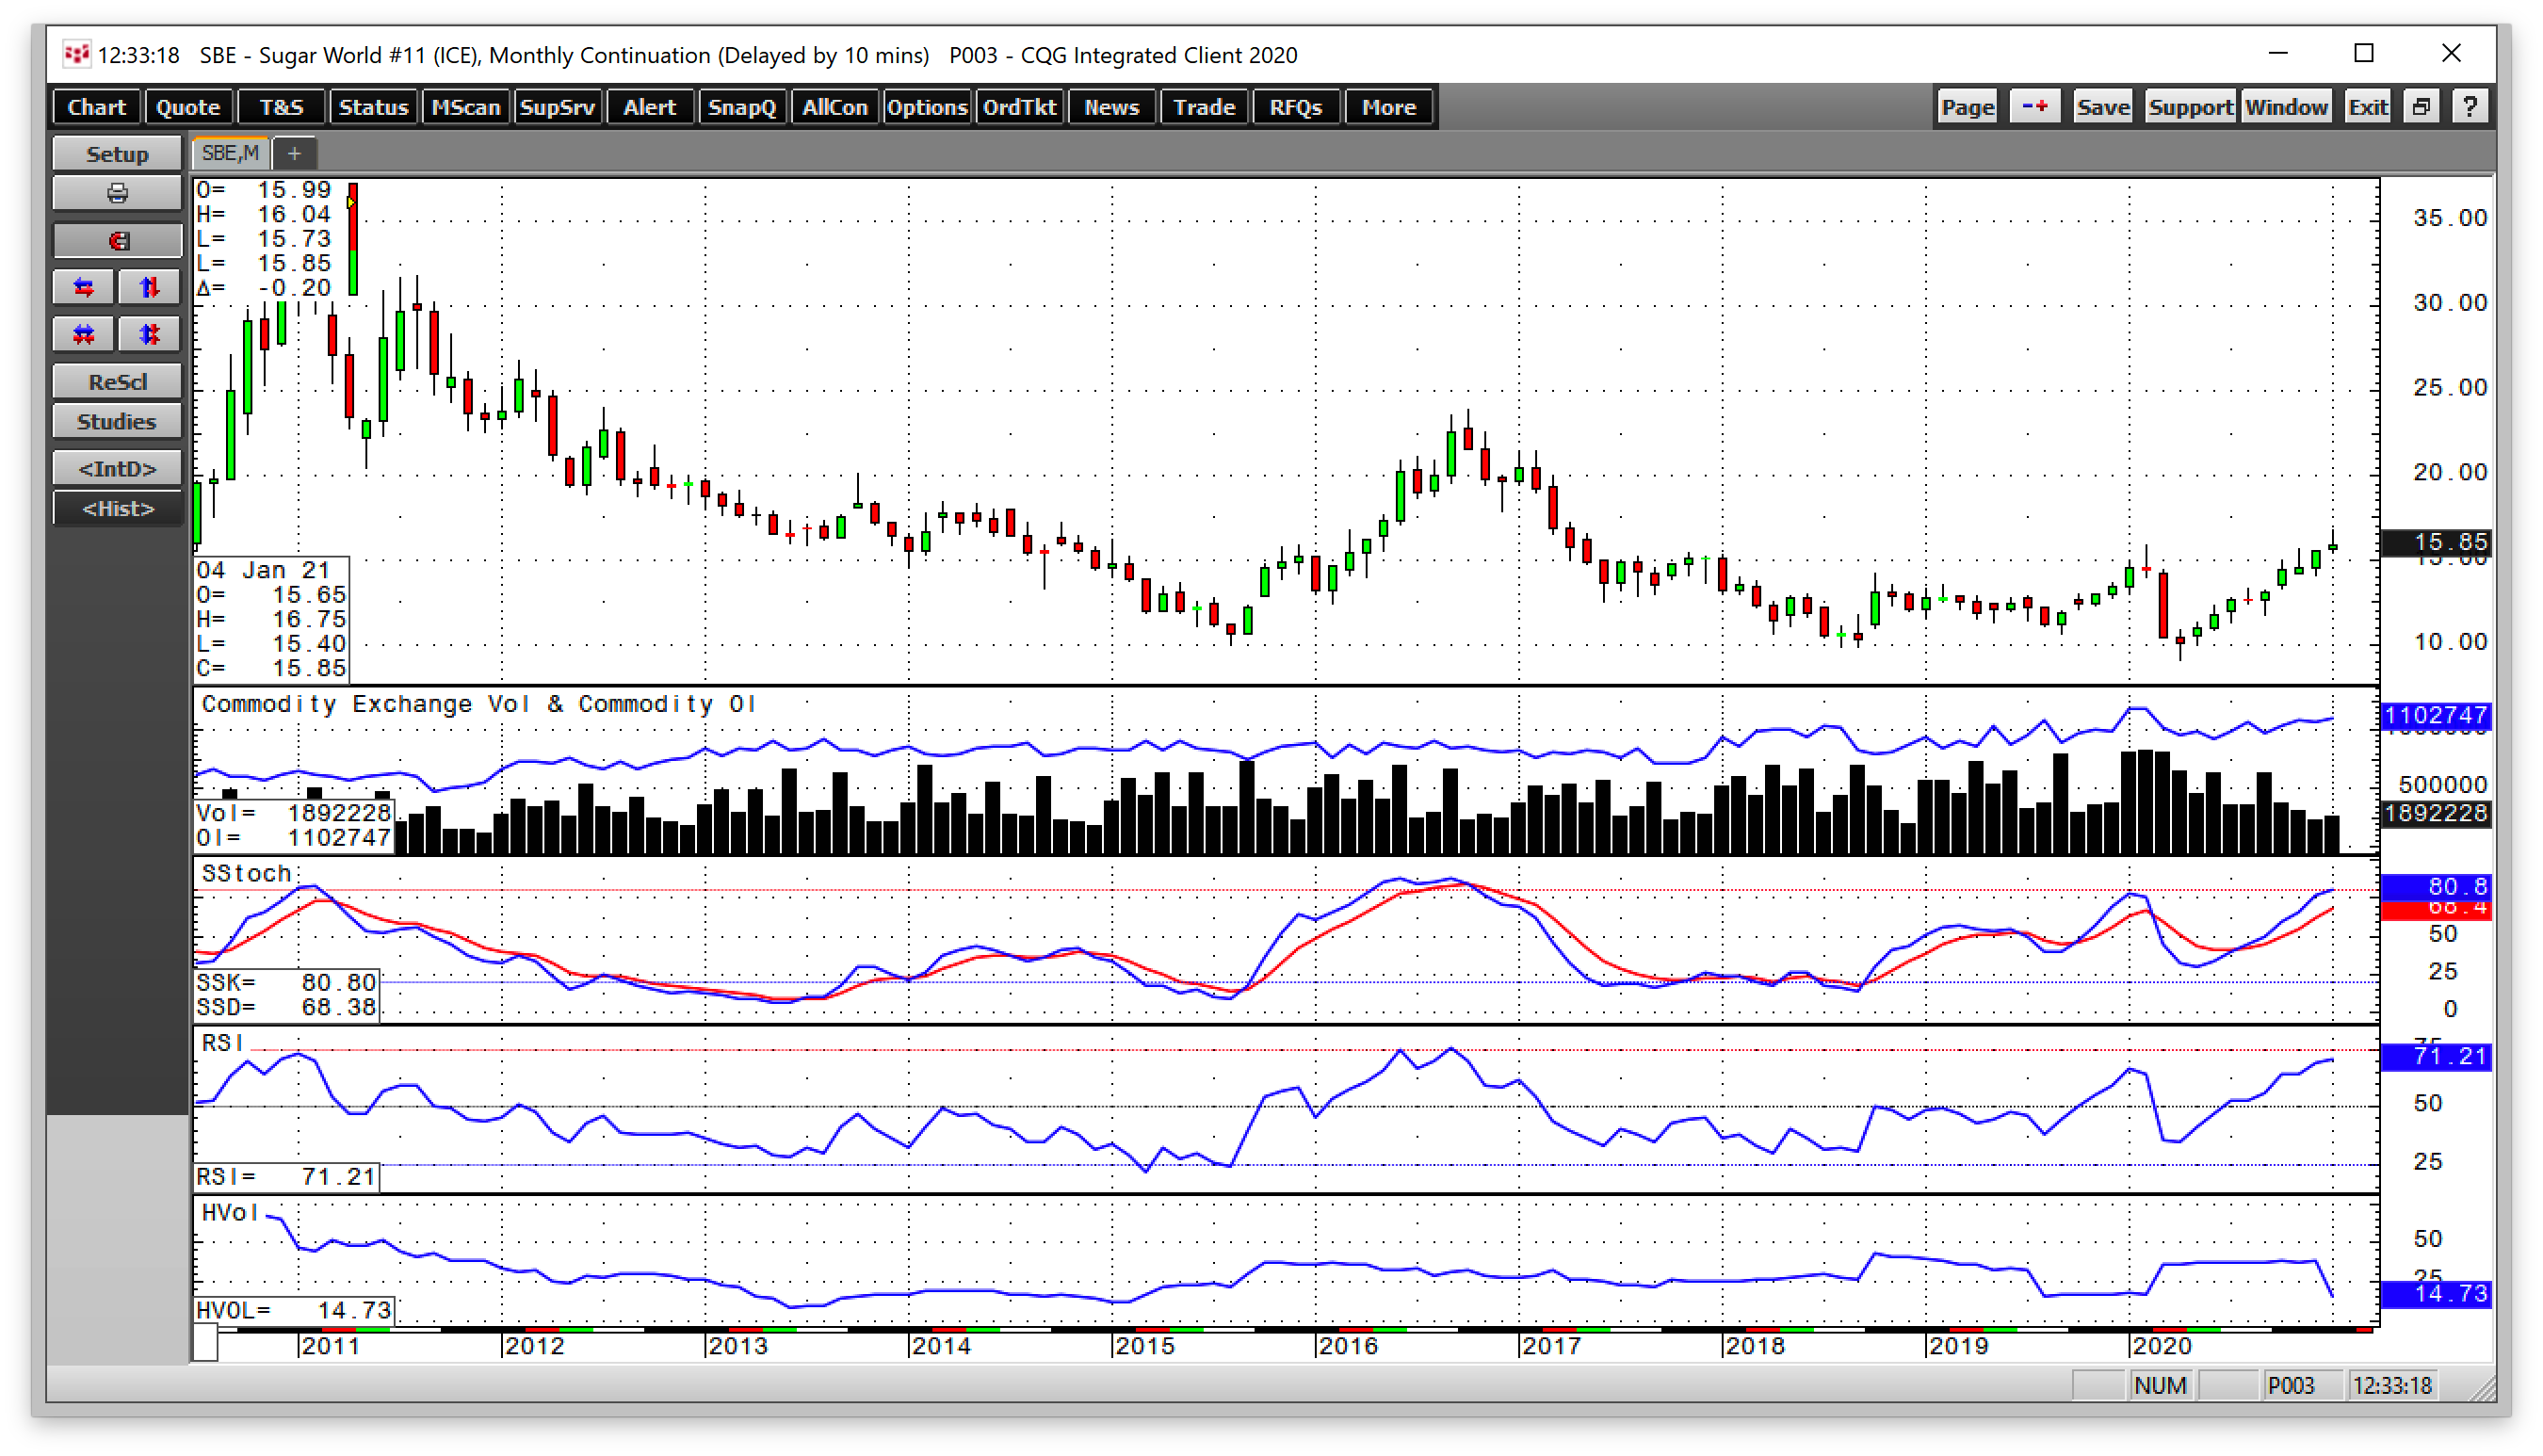
In the world sugar futures market, 2020 was a volatile year. The sweet commodity’s price rose to a high of 15.90 cents per pound in February, which was the highest level for the commodity since May 2017. The global pandemic caused a meltdown in markets across all asset classes, and sugar was no exception. In April, the price dropped to 9.05 cents, the lowest level since 2007.
Since then, sugar posted gains in eight consecutive months.

Source, all charts: CQG
The monthly chart highlights that a close above 15.50 at the end of January 2021 would mark sugar's ninth straight monthly gain. On Jan. 14, nearby March Ice sugar futures traded to a high of 16.75 cents, which was the highest levels since April 2017.
The next technical upside target now stands at the October 2016 high of 23.90 cents. From a technical perspective, the monthly trend is bullish with rising price momentum and relative strength indicators.
Open interest, the total number of open long and short positions in the ICE (NYSE:ICE) sugar arena, rose with the price, moving from 925,173 contracts on Oct. 1 when the price was below 14 cents to over 1.1 million contracts as of the end of last week, with the price north of 15.80 cents per pound. Increasing open interest and rising price tends to be a technical validation of a bullish trend in a futures market. Monthly historical volatility dropped from over 37% to 14.73% as sugar’s upside price action has been slow and steady.
Three factors will determine the path of least resistance for the sugar market over the coming weeks, months, and years.
1. Keep an eye on the Brazilian currency
Brazil is the world’s leading sugarcane producer and exporter. Producing sugar is labor-intensive, which means labor costs are in the Brazilian currency, the real. The ICE sugar contract is dollar-based, making the sugar price sensitive to the currency relationship between the dollar and the real.
A falling real tends to weigh on the price of sugar as it becomes less costly to produce the soft commodity from a labor perspective. A rising real tends to have the opposite impact on the dollar-based sugar price.

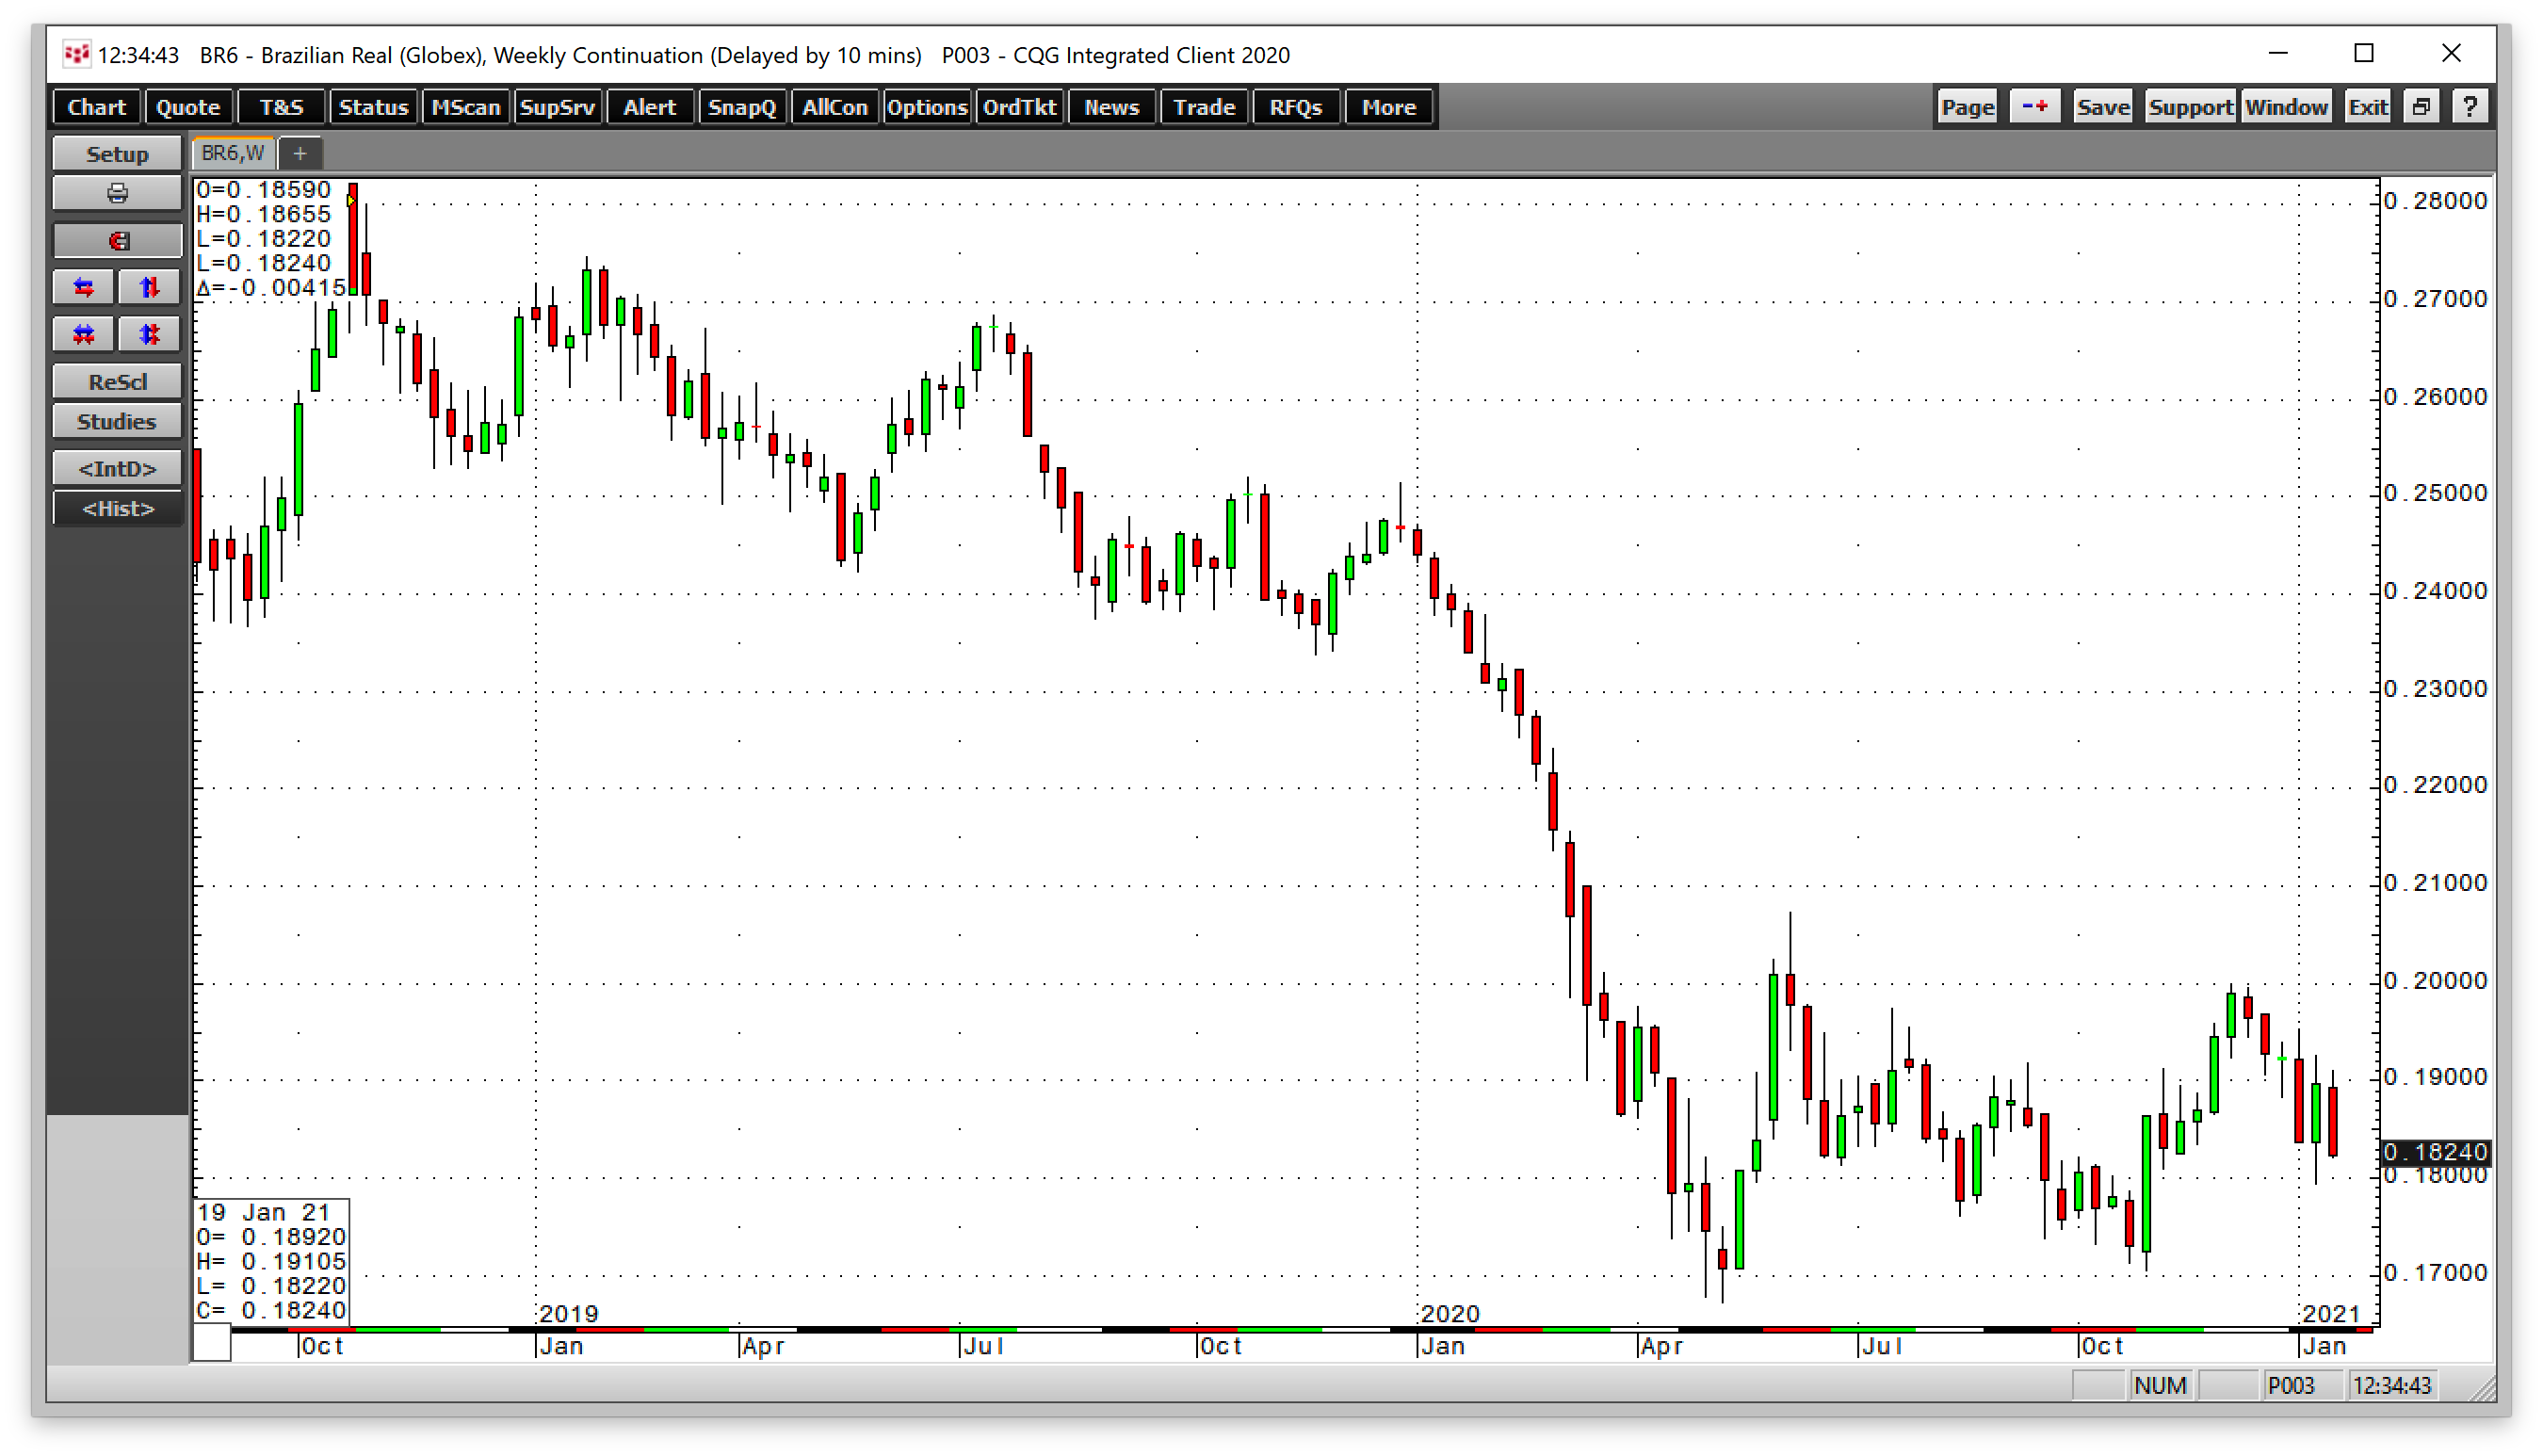
As the weekly chart illustrates, the Brazilian real hit a low of $0.1673 in mid-May 2020 when sugar was just recovering from the 9.05 low and trading around the 10 cents per pound level. Since then, the real recovered to over the $0.1800 level at the end of last week. Since last April, the Brazilian real has made higher lows, pushing Brazilian labor costs higher, which supports a higher price for the soft commodity.
2. Energy prices are bullish for sugar
In the US, the primary ingredient in ethanol production is corn. The United States is the world’s leading producer and exporter of coarse grain.
In Brazil, sugar is the input in biofuel production. Therefore, sugar tends to be sensitive to crude oil and gasoline prices. 
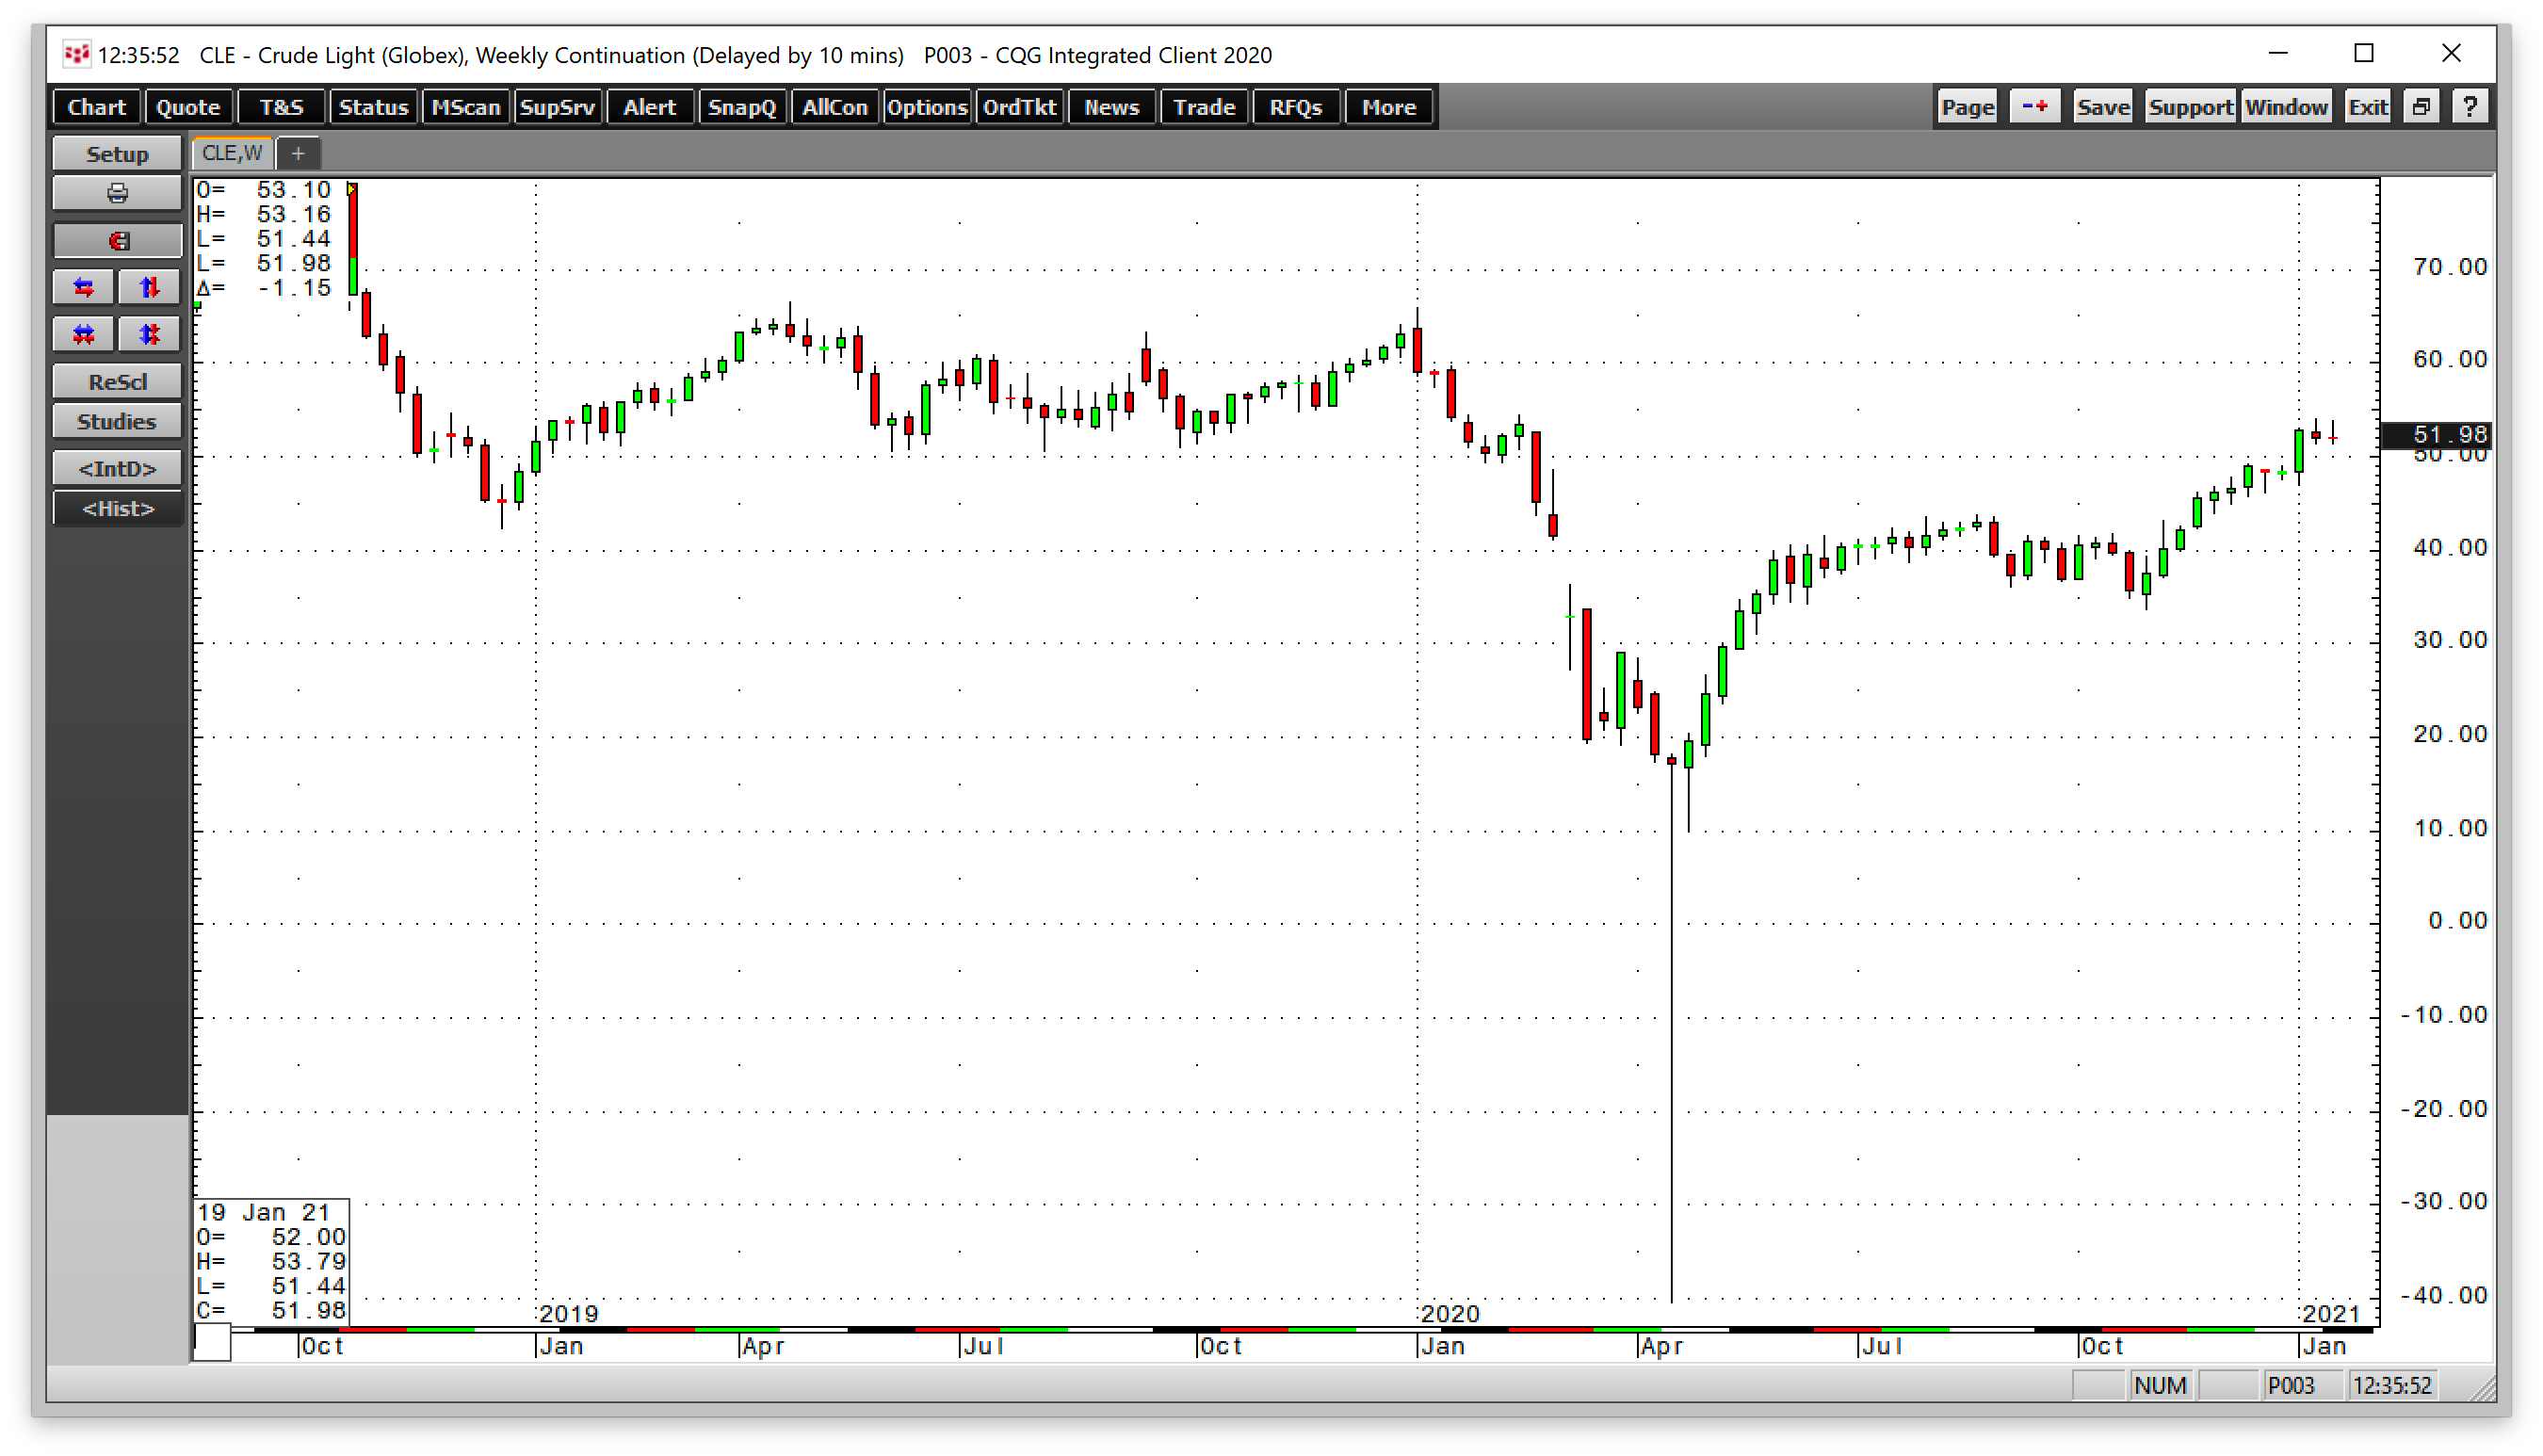
The weekly WTI chart highlights the rise from below zero at the lows in late April to around $52 per barrel on Jan. 22. 
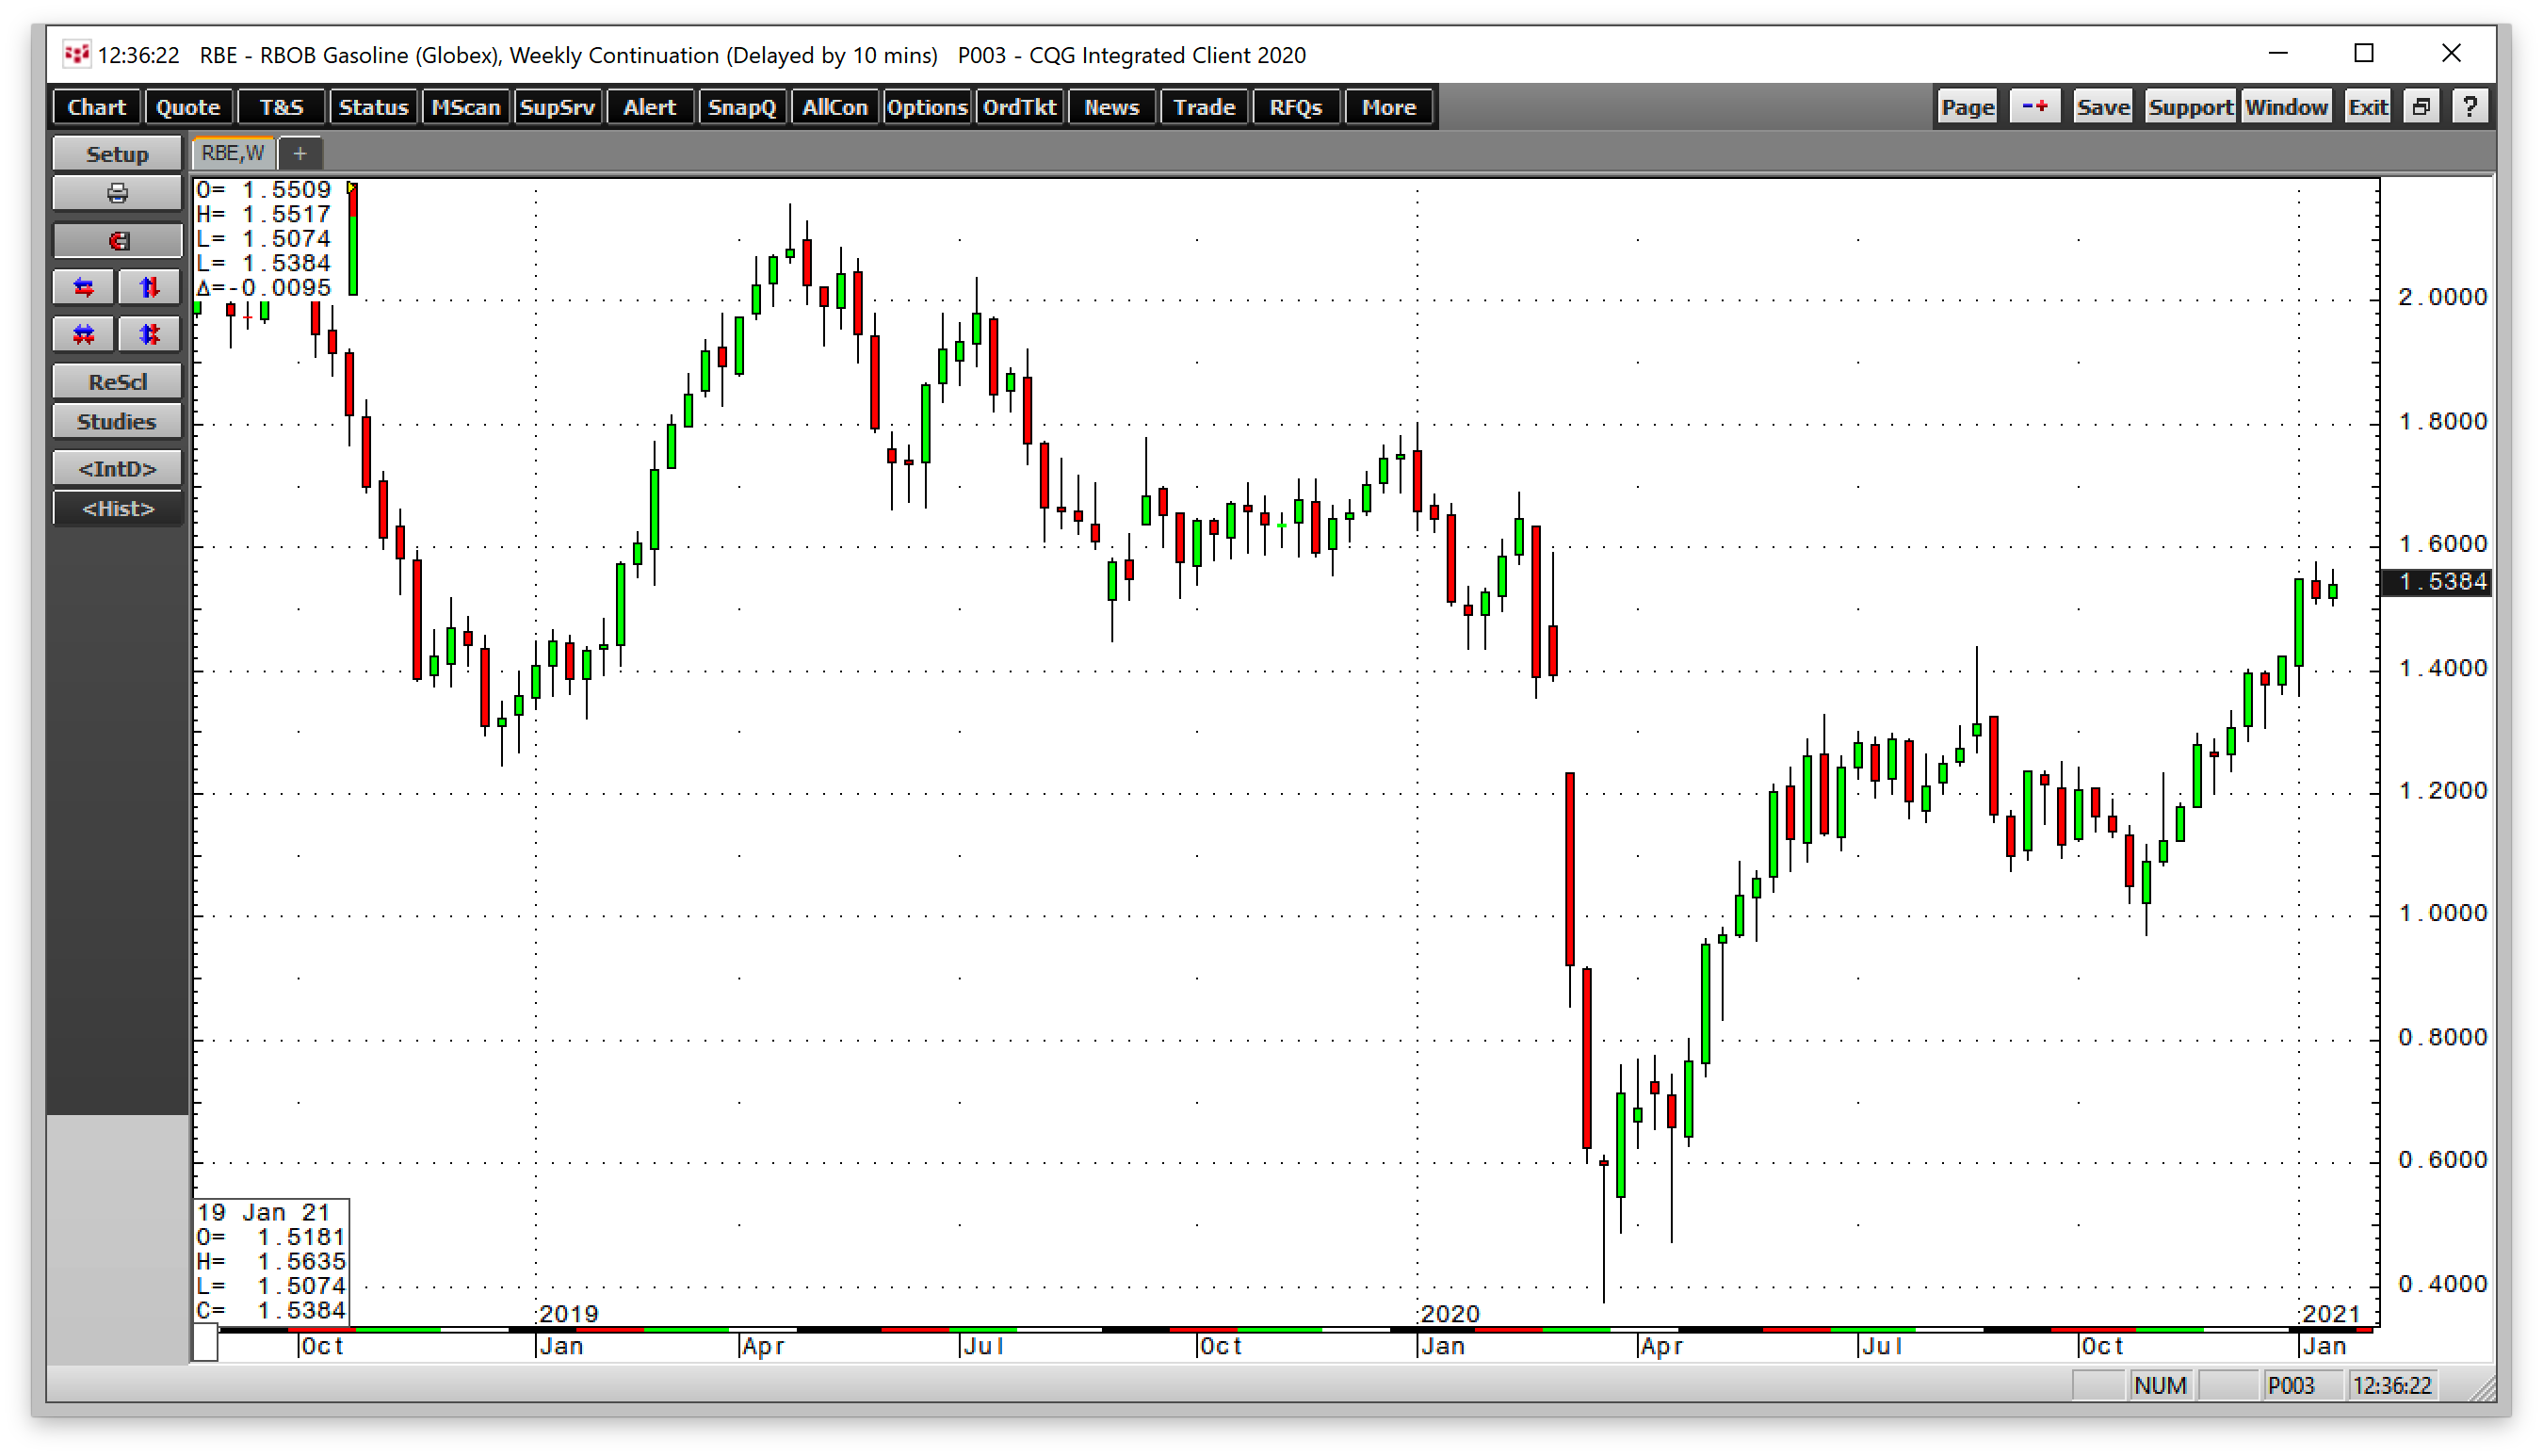
Gasoline prices have risen from a century low of 37.6 cents to over $1.53 per gallon at the end of last week. Gasoline has reached the price level where it was trading in January 2020, before demand evaporated during the start of the global pandemic.
The price action in crude oil and gasoline markets supports the rise in the sugar price.
3. Weather in Brazil is always a critical factor
The weather in Brazil is always a critical factor for the annual sugar crop. However, supply chain issues in 2021 could become a more significant issue.
Brazil is South America’s largest economy and most populous country. COVID-19 has wreaked havoc in Brazil as it has suffered the third most infections behind the US and India. Brazil is second only to the US in coronavirus fatalities. While the weather remains a significant factor, the virus could create logistical and employment problems for producing, processing, and exporting sugar worldwide.
Meanwhile, a tidal wave of global central bank liquidity and a tsunami of fiscal stimulus from governments increase the money supply and widen deficits. The monetary and fiscal policies addressing the pandemic are highly inflationary.
Commodity prices tend to rise when fiat currencies’ purchasing power declines. The sugar futures market broke out to the upside at the start of 2021 when the price moved above technical resistance at 15.90 cents per pound.
In a commodity bull market, sugar has explosive potential
An ETF and an ETN track the price of the soft commodity
Bull markets rarely move in straight lines. Corrections can be violent, but they create opportunities. With the commodities asset class facing its most bullish landscape in decades, sugar is a market that could surprise or even shock to the upside.
If the period from 2008 through 2011 is a model for 2020 and the coming years, sugar could have lots of upside. The global financial crisis in 2008 was a far different event than the pandemic. However, central banks and governments have used the same tools to stabilize the economy. The only difference is the level of liquidity and stimulus in 2020 is far greater than in 2008.
In 2008, sugar futures fell to a low of 9.44 cents. By 2011, the price peaked at 36.08 cents per pound on the nearby ICE futures contract. I am a buyer of the sweet commodity on price weakness, as the technical trend is higher, and fundamentals support a higher price.
The most direct route for a risk position in sugar is via the futures and futures options that trade on the Intercontinental Exchange. Two tools seek to replicate the price action in the sugar market for those who do not venture into the futures arena.
The Teucrium Sugar Fund (NYSE:CANE) is an ETF product that holds a portfolio of three actively traded futures contracts. Since the nearby futures contract tends to experience the highest price volatility level, the CANE ETF often underperforms that price action of the nearby sugar futures contract on the upside but outperforms on the downside.
The iPath® Series B Bloomberg Sugar Subindex Total Return ETN (NYSE:SGG) tends to follow the nearby sugar futures contract on ICE more closely, making it a more volatile product. Moreover, an ETN carries the additional credit risk of the note’s issuer, while an ETF has the risk of the products held in its portfolio.
Whether you choose to buy sugar on the futures market or via the ETF or ETN products, the soft commodity looks set to continue to deliver sweet returns over the coming months and years. Keep a close eye on the currency relationship between the US dollar and Brazilian real and energy prices as they tend to guide short-term price movement in the sugar market. Buying sugar on dips could be the optimal approach in 2021.
