
US stocks went up yesterday
The major indexes on Tuesday rose after four consecutive negative days.
The S&P 500 gained 0.10%, the Nasdaq went up 0.01% and Dow Jones closed at +0.28%.
The stock market rose because the Bank of Japan raised a new cap on the benchmark rate, shifting from 0.25% to 0.5% the chance to rise its 10-year bond yield curve.
Investors have seen this action as a starting point to change the ultra-relaxed monetary policy adopted by the BOJ so far.
What to watch today
On Wednesday, 21 December at 15:00 GMT, are going to be released two important data: consumer confidence and existing home sales.
S&P 500 Technical Analysis - Daily Chart
The S&P 500 index bounced at the horizontal support line at around 3800, creating a "hammer" candle, which is a bullish sign for the immediate short term.
Is this a bull trap or can we expect more downside?
The index might keep rising today and retest the 50-day MA (red moving average).
If the price is able to break above it and also above the horizontal support at around 3900, we can expect the rally to continue.
However, we think that the upside potential is very limited at the moment since there are many resistance levels for the price.
If the price gets rejected at the 50-day MA, we can likely expect the price to drop and break below the support at 3800 and retest the next support level at around 3700 and potentially reach the final target at 3600.
The overall trend for the S&P 500 index is still bearish and this potential rally might be just a pause before the continuation to the downside.
The RSI rose slightly to 42, indicating still a bearish trend.
Overall, the index price could fall further in the upcoming days, until it reaches the oversold condition on the RSI.
Dow Jones Technical Analysis - Daily Chart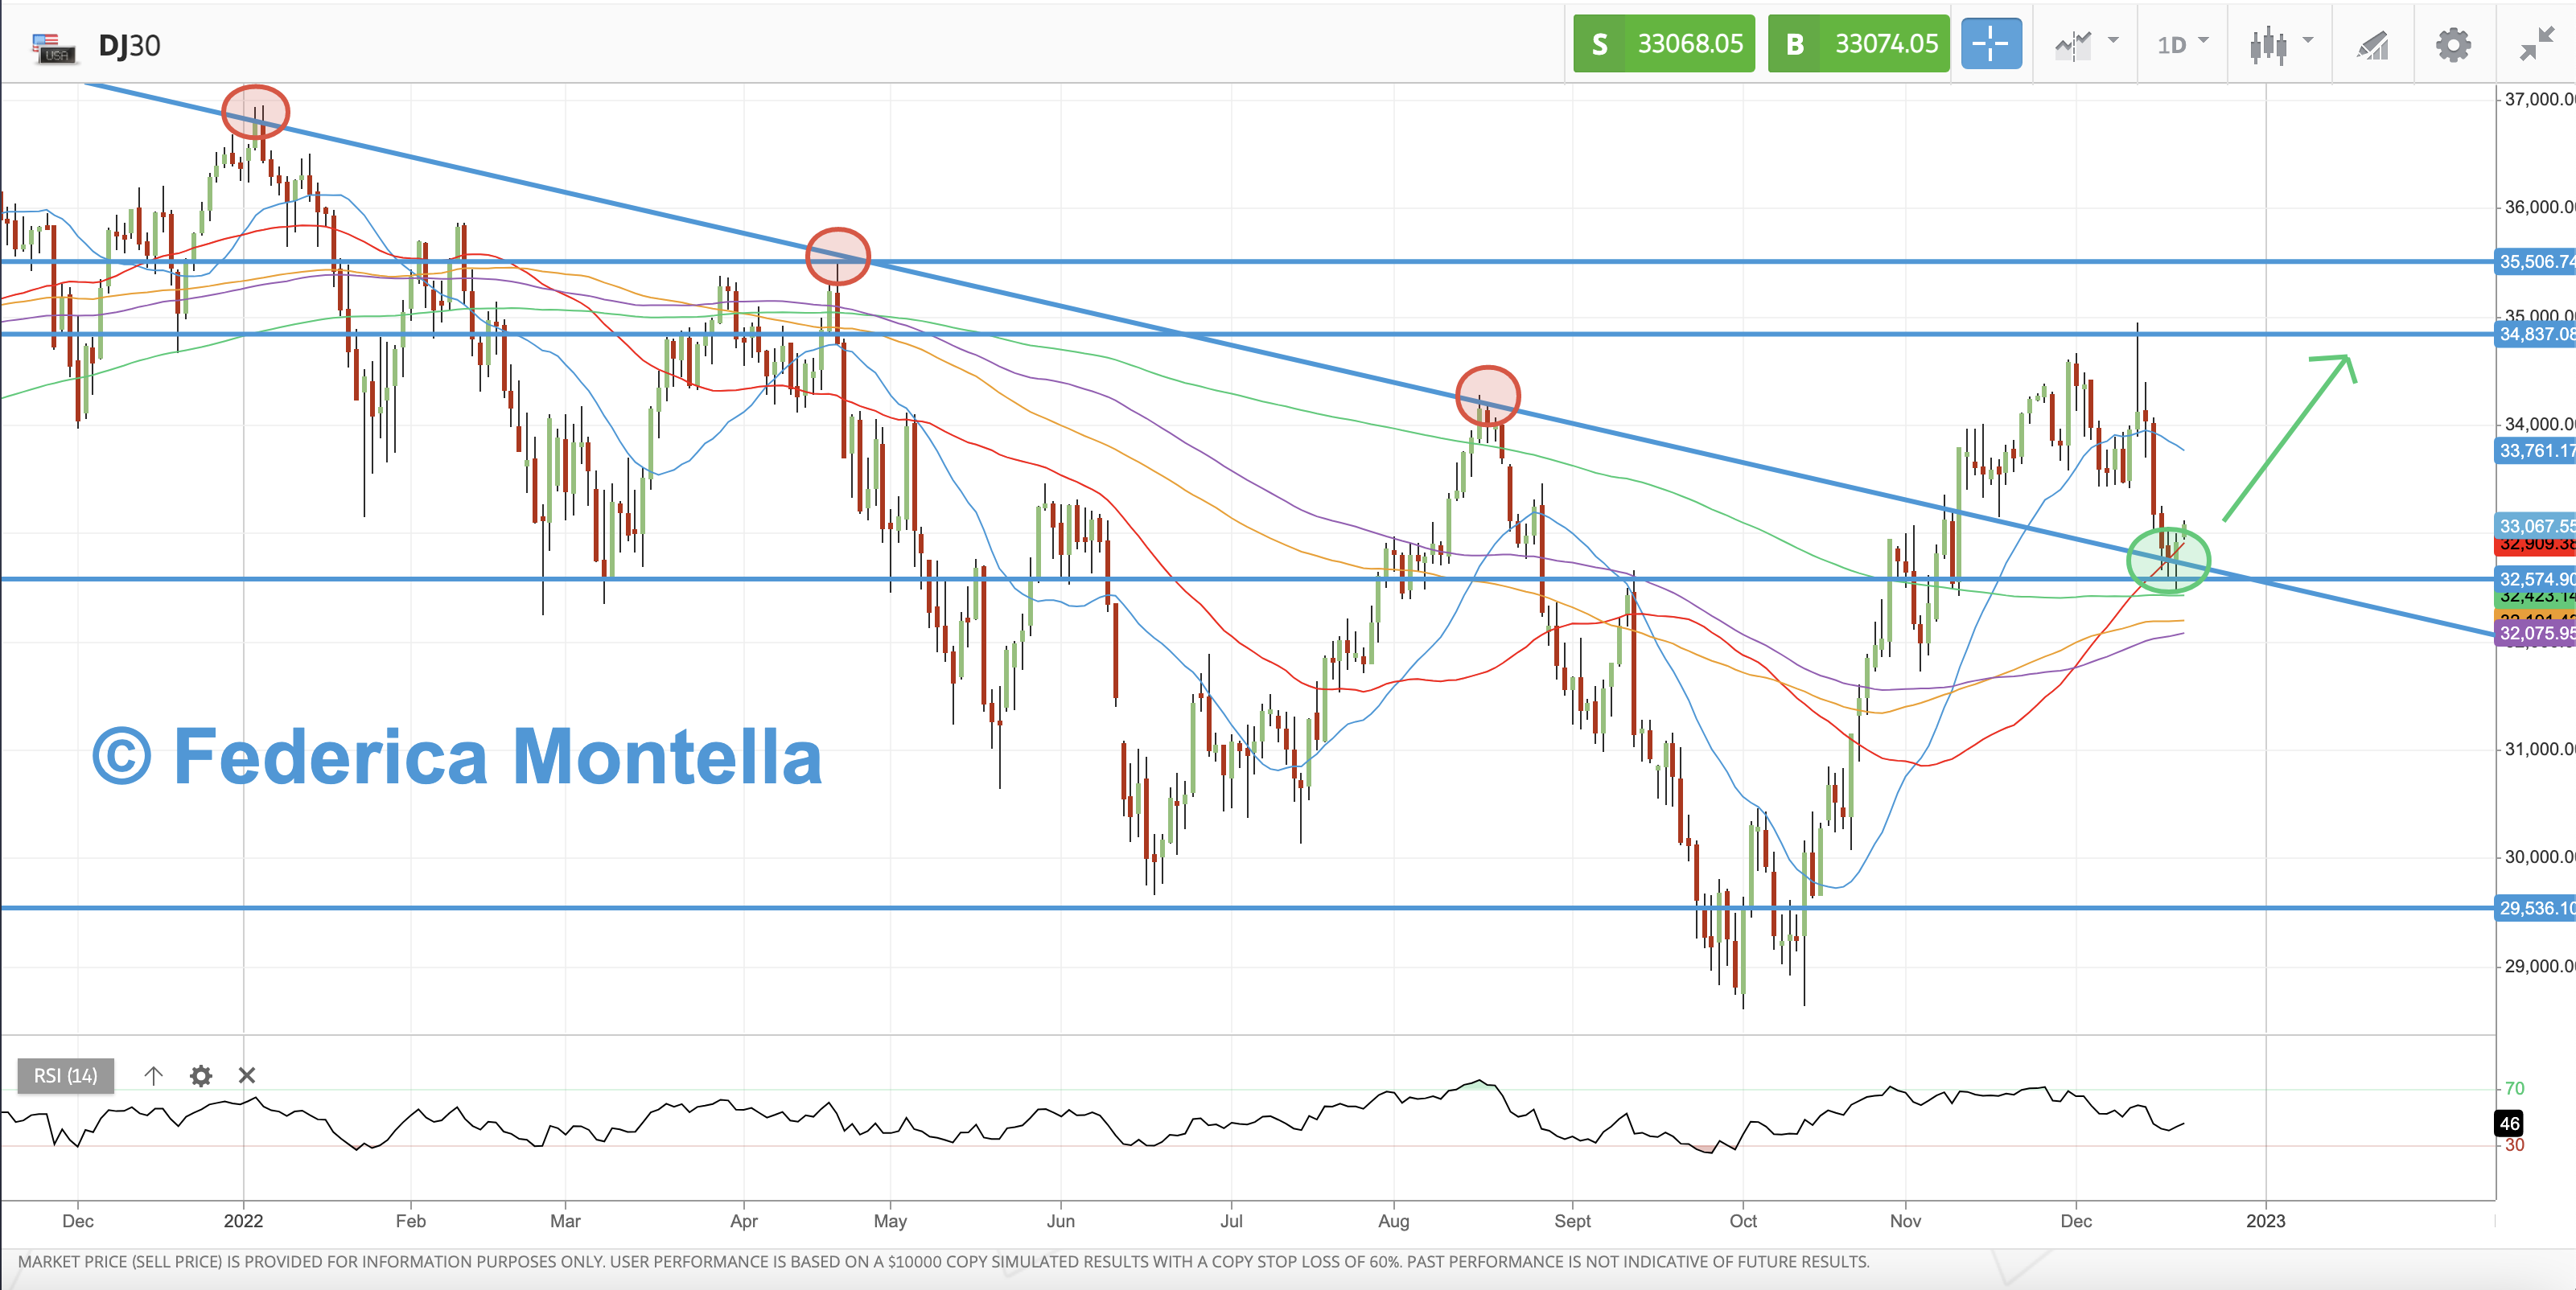
The chart of the Dow Jones Index is showing a different view of the US stock market.
The Dow Jones Index broke above the bearish trendline on 10 November 2022 and it looks like this trendline is now acting as support (see the green circle in the chart).
The whole area between 32400 and 32900 is potentially a strong support zone for the index price since it has a confluence of many technical levels, such as the 200-day MA (green moving average), the horizontal support at 32575, the cross of the bearish trendline and the 50-day MA (red moving average).
Therefore, the price action of the Dow Jones Index is bullish, compared to the price action of the S&P 500 and Nasdaq indices, which are bearish instead.
Based on this, we can expect the price to rise and test the 21-day MA (blue moving average) in the upcoming days and potentially move up to the resistance at 34837.
So, what is the Dow Jones saying?
If the Dow acts as a leading index for the overall US stock market, we could expect also the S&P 500 and the Nasdaq indices to turn bullish in the upcoming days.
Therefore, watch closely the price action of this index for clues on the next market direction.
Sentiment Indicator - Fear & Greed Index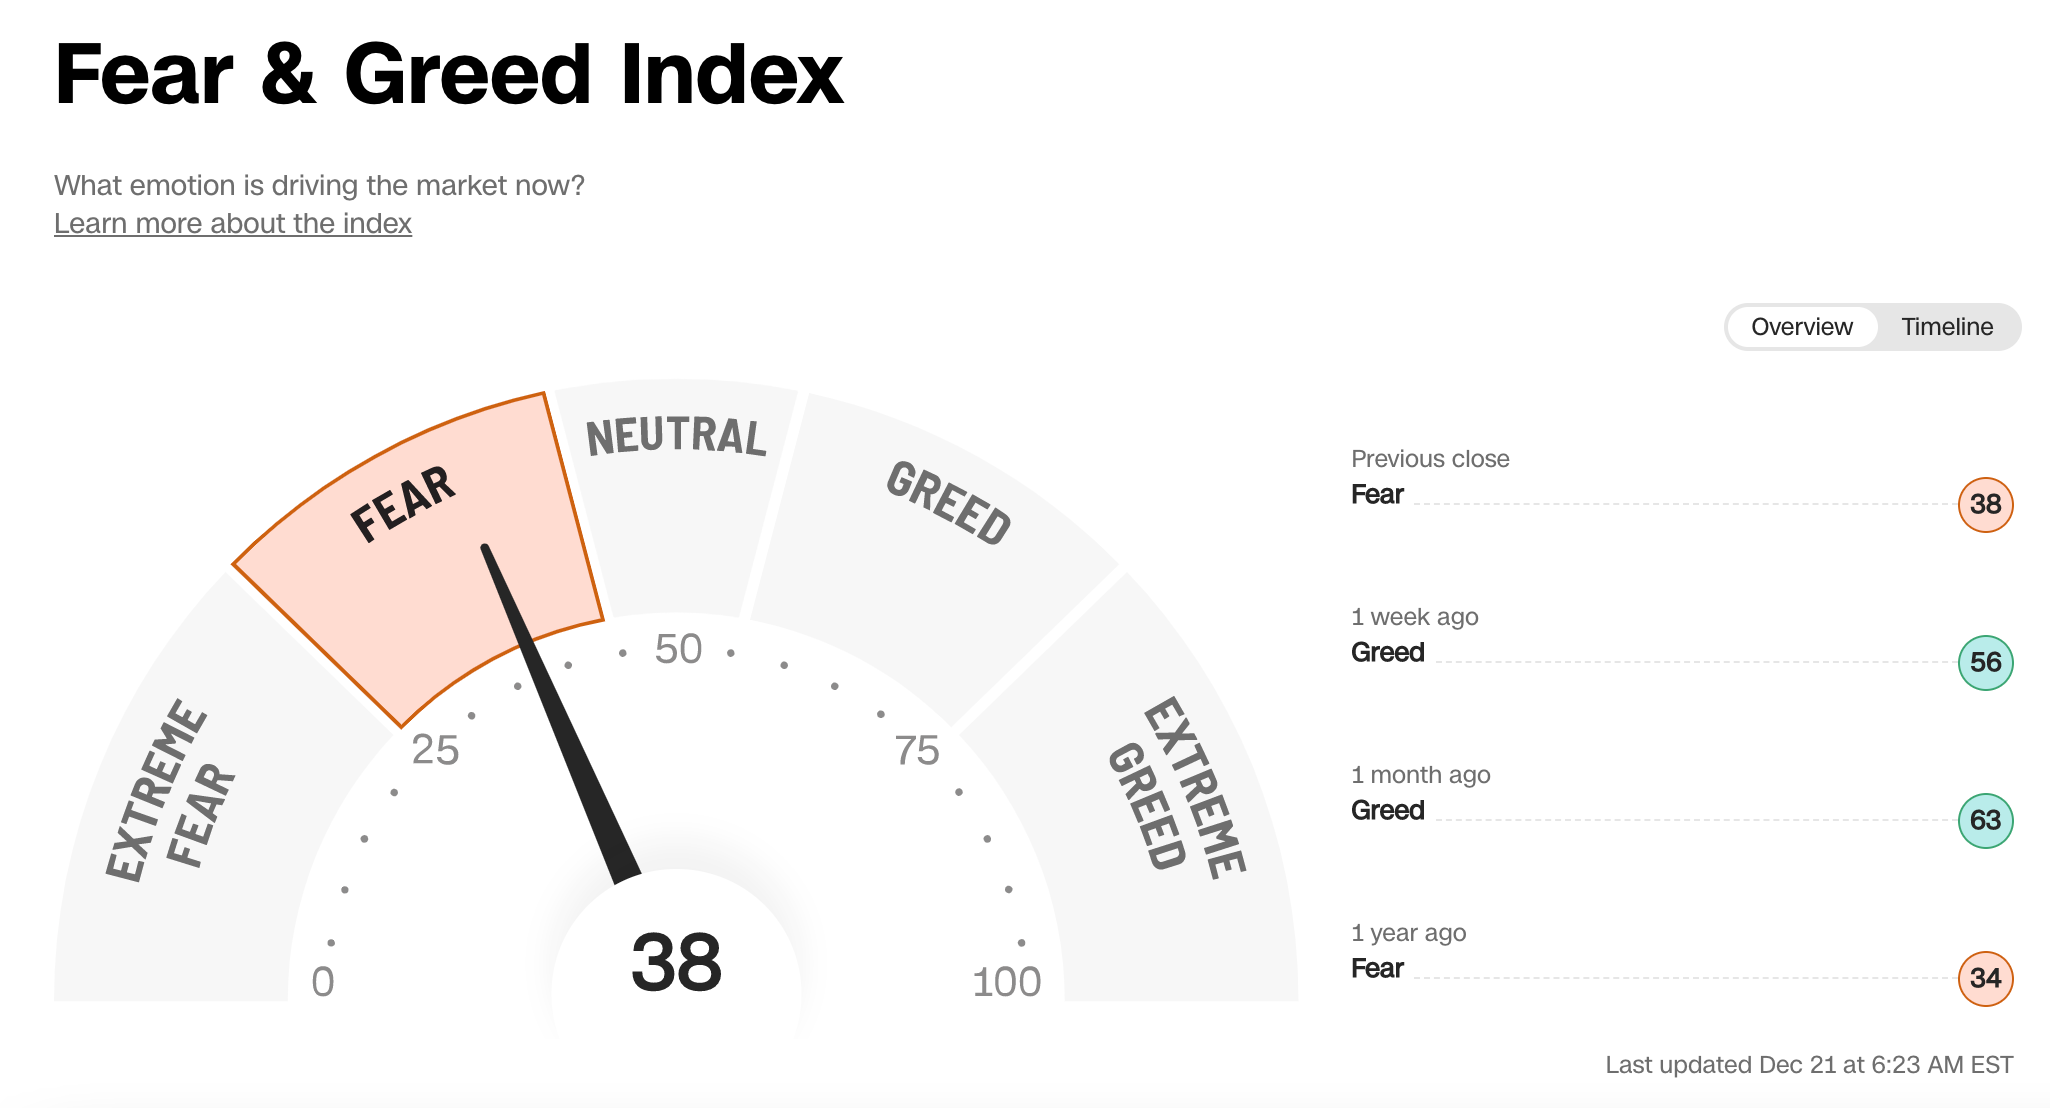
The market sentiment is at 38 in the "Fear" mode which is at the same exact level as yesterday.
Follow me
If you find my analyzes useful, and you want to receive updates when I publish them in real-time, click on the FOLLOW button on my profile!
Disclaimer
I’m not a financial advisor.
Any opinions that I publish may be wrong and may change at any time.
You should always carry out your own independent verification of facts and data before making any investment decisions.
Past performances are not indicative of future results.
I do not accept any liability for any loss or damage incurred from you acting or not acting as a result of reading any of my publications.
You acknowledge that you use the information I provide at your own risk.
Please be aware that all trading involves risk.
This content is for educational purposes only and is not investment advice.
Which stock should you buy in your very next trade?
AI computing powers are changing the stock market. Investing.com's ProPicks AI includes 6 winning stock portfolios chosen by our advanced AI. In 2024 alone, ProPicks AI identified 2 stocks that surged over 150%, 4 additional stocks that leaped over 30%, and 3 more that climbed over 25%. Which stock will be the next to soar?
Unlock ProPicks AI