As I noted to my VIP Traders Club members, on the recent data dump days, the Dow swung violently by around 600 pts up and then down and then up first on the FOMC of 1 February and then again on the US CPI of last Tuesday. I thought then that this was curious – near-exact 600 pts swings on each data day. Coincidence?
But those very fast inter-day swings are not really tradeable with my Tramline Trading method unless you are extremely nimble (and lucky!) and using 2-minute charts. I am exhausted just thinking about it.
But the chain was broken on Wednesday on the US Retail Sales with an up/down swing of only 300 pts. But the takeaway is that the markets became highly emotional on the days the data were released. This is perfectly normal on such days but what stands out is the formation of spike highs on extreme emotional days.
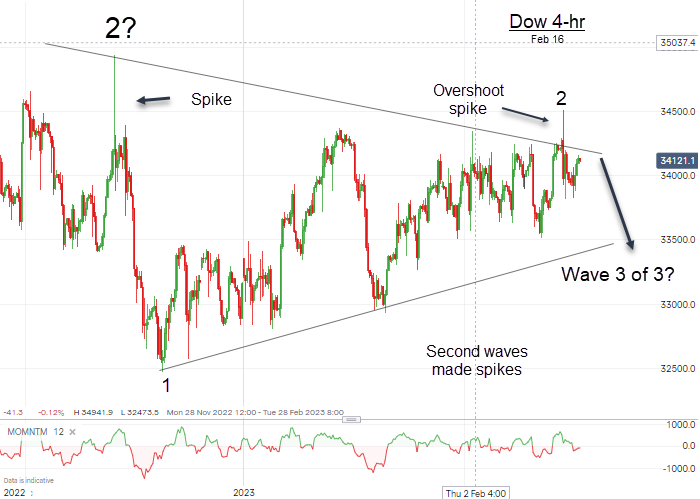
Spikes to new highs are signs of buying exhaustion. The first spike shown is the 13 December FOMC spike and the second is the recent Tuesday CPI spike. Crucially, the latter made an overshoot of the upper triangle line – and these are normally reversal signals if they follow a bull run -and a warning to the bulls.
Note that the December spike led to a savage decline of over 2,000 pts. Will history repeat for the Tuesday spike?
For a swing trading strategy, where we are looking for sustained moves over weeks/months, the Dow has been trendless for a few months – and a nightmare to figure out the most likely Elliott wave pattern! It has not been possible for me to form a trading strategy with confidence. In fact, the Dow is trading precisely where it did last November.
The wonderful thing about triangles is they always resolve (before the apex is reached).
By extending the converging triangle lines in the above chart, you can work out the maximum time extent of the triangle. The market must move out of the triangle before that date – usually well before. So we have the latest date when the break must occur.
And the first move out often provides a very good clue as to which direction is the next big move (although head fakes do occur to prove there are no guarantees in the markets).
Thus I have been looking for a sustained move down where position trading once again becomes the optimum strategy. rather than the short-term and day trading approach most suitable for these range-bond markets.
Remember, when all is looking confused and in turmoil – as now – that is the best time to expect the fog to suddenly clear and to position yourself for some really big moves. But that time is not here yet.
Now if my Elliott wave labels are correct, the market should not push above the recent wave 2 high at 34,520 or even the upper trendline at 34,100 area. If it did, my wave 2 labels would be void. But so far, my wave 2 is in a clear a-b-c up (corrective to the main downtrend) and it could turn lower at any time.
The 34,520 level is my line in the sand for my bearish case.
So what is my outlook now? The macro-environment has recently been dominated by the belief that because price inflation is falling back, the Fed will be inclined to cut back on their rate hikes, and with record low unemployment, the US economy will avoid a recession and power ahead strongly.
I believe that is the wrong narrative. A more realistic one is that interest rates are still moving higher as are wage/salary rates with a consequent squeeze on company profits – and the prospect of company bankruptcies shooting higher (they are already moving in that direction). Company valuations will decline together with house prices.
With the prospect of lower company dividends ahead, bond funds are looking a lot more attractive with a growing movement out of equities into IG bonds. As for High Yield bonds, they will fall with equities.
Already, the dividend yield on the S&P 500 is only 1.55% while the yield on the ultra-safe 10-yr T-Note is higher at 3.82%. Hmm.
Thus, this fall-back in inflation is not the bullish signal imagined but a bearish flag for a slowing economy.
And the latest Friday US Leading Indicators back this up. January posted the eleventh straight monthly decline in LEI with new manufacturing orders down hard. It seems inevitable the US is in or is now entering a recession with the Q1 GDP growth negative.
Adding to woes, tech jobs are being axed in droves and these are the highest paying. Where will those laid off go? To flipping burgers? To the struggling Net Zero industry?
But to add to the chart confusion, on Friday the Dow did drop to test the lower triangle line – and bounced making the latest decline a possible three down a-b-c (corrective). And this sets up the option of moving higher! Only an immediate turn lower early next week would negate this.
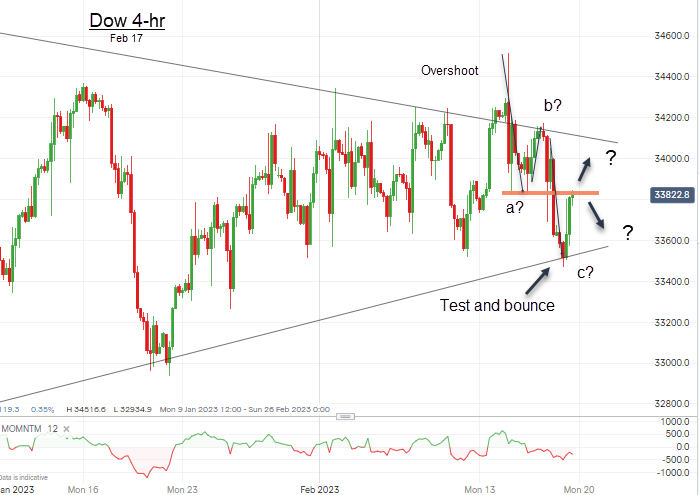
Thus, there is still no realistic swing trading strategy that I can devise yet. And that is why I have avoided trading the Dow (in preference to the weaker Nasdaq) in recent weeks. If the Dow can break below the ‘c’ wave on the lower trendline, that will be my signal to kick off a major bear campaign.
I will continue to watch and wait on the Dow for now.
Incidentally, as you know I take rough current sentiment readings from the MSM headlines and right now, all I see is a strong polarisation between the Fed doves (bullish) and the economic realists (bearish). This equal tug-of-war has produced no Dow movement in three months. Will something out of left field shift the dial?
Will there be a credit downgrade of a significant company hitting the headlines? Will a sudden approach to bankruptcy appear? And there is the looming Congress decision on whether to push the US debt ceiling ever higher into the stratosphere.
Of such are bear markets born.
Manic bullish fever still lives!
Most of us have enjoyed following the ups and downs of a no-hoper stock GameStop Corp (NYSE:GME). That hit the headlines when inexperienced retail traders on Reddit clubbed together on social media and decided to give the hedge fund shorts a fright. This they did in spades.
But of course, what goes up must come down when the company is loss-making and has nothing to back up extreme valuations- here is the amazing chart
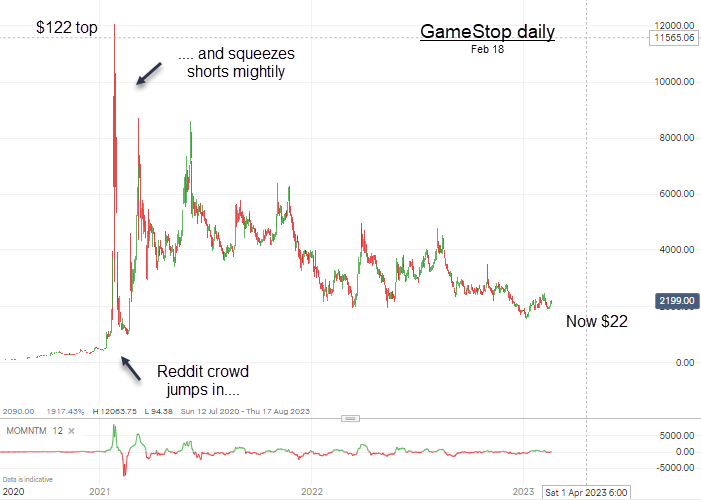
From $1 to $122 in a few days in early 2021! With that kind of action, naturally, more retail ‘investors’ were attracted to gambling on stocks during the lockdowns. They are now a force to be reckoned with.
And they are still here! Here is the latest bust-to-boom share, DraftKings Inc, a sports betting outfit
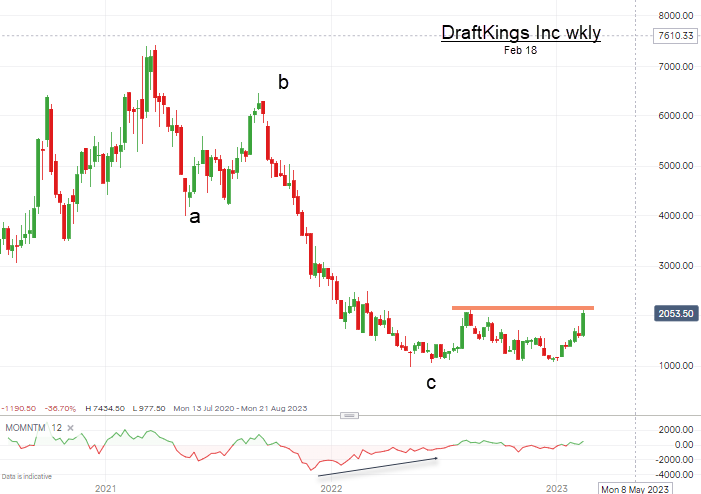
Legal sports betting is a relative newcomer to the US and the initial bullish hopes for the industry were dashed by the reality the company has been loss-making from the start (and still is) but a glimmer of hope emerged on Friday with prospects of a less-than-expected operating loss for this year.
The shares have been hammered down from the $75 high to the recent $10 low (now $20) but the Reddit crowd seems absent so far will they latch on to it and shoot it higher?
Who likes chocolate?
We all love chocolate! And now traders have another reason to love it. The commodity that turns into chocolate is one of the Tropical commodities: Sugar, Coffee and Cocoa. Trading them on a commodity trading platform such as with a spread betting outfit is the best way to trade commodities with the charts provided for retail traders such as us.
I have been tracking Cocoa for some time and just like the Dow, it has been range-bound forming a massive multi-year triangle. It has not been an attractive market to find good trends – until now. Here is the long-term monthly
This is the long-range chart I posted to VIP Traders Club members last week
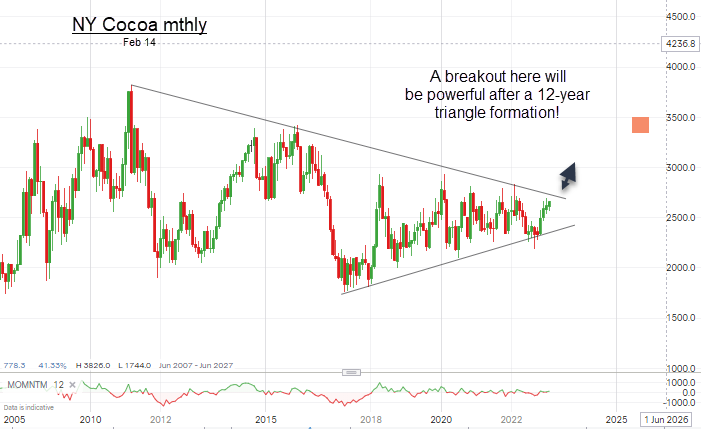
For several years, the market has swung around and since 2015 has been forming a massive triangle. Finding a professional trading strategy in this market has been nigh on impossible. Sustained swing trends there have been none.
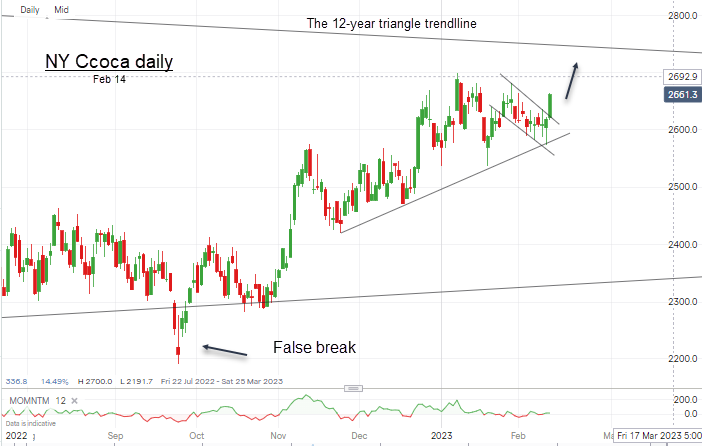
But last week, I noted the growing potential for a huge upside break out – and a potential tradeable trend. Here is the daily chart I posted earlier to VIP members:
One of the features of the Tropicals is that they are pretty immune to the machinations of Mr. Powell and his friends, unlike the financials. Cocoa traders rarely get in a tizzy over what the Fed will do at their next FOMC chinwag. And that places them in a commodity group apart from most of the others – a great advantage.
It seems I was not alone in spotting this setup. Right after posting my Buy note, the market shot up and has now even pushed up above the 12-year trendline. That is important.
What is even more important is that there seemed to be little market ‘news’ to account for the surge, This is a lesson in what drives markets (hint: it’s not the news).
To clearly break a 12-year-old trendline is a major market event (and a half), This trendline had been resisting rallies for 12 years – several lifetimes in the market. It has to be respected. And chart technicians are doing just that by trading with the new trend and pushing prices even higher.
So unless the rally totally breaks down, my pink target around $3500 is in my sights (latest $2780) – about a $720 potential gain at least. For a very modest £10 per point spread bet, that is a potential profit of over £7,000. Now that would be a terrific swing trade and one I have my sights on.
UK bank shares are truly overbought – and vulnerable
We trade Lloyds (LON:LLOY) for Pro Shares members and recently, I advised taking profits. That judgment was based on this chart
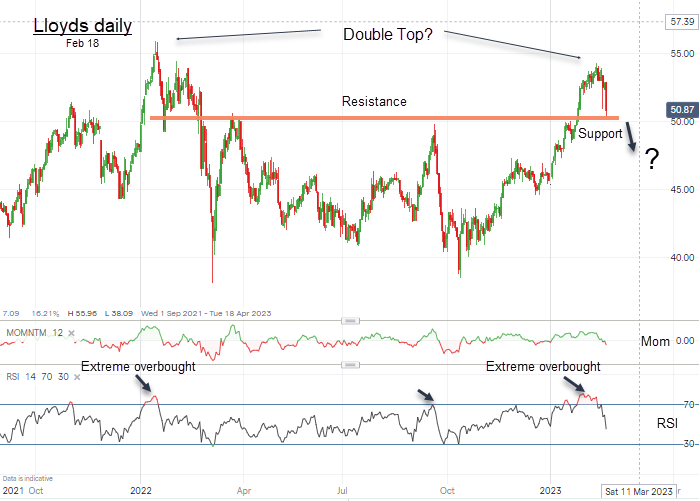
The main feature is the potential Double Top at the 56p level. It reached it first in January last year and again last week on an extreme Relative Strength Index reading which was well over the critical 70 levels.
And from that level last year, the shares crashed to 38p (off 33%) in March. Will history repeat this time?
On Friday, they moved down to test my pink support/resistance barrier and a break below would firm up my Double Top thesis.
Of course, any bad news from the mortgage market – and possible growing UK company bond defaults – would pressure the shares.
