
The US Dollar’s performance has been underwhelming recently with the dollar index (DXY) reaching a two-week low. Not even the ramping up of the “Trump trade” after the attempted assassination of the former US president has helped the currency recover. A clear softening of the US economy has weighed on the dollar as markets become more confident that the US Federal Reserve will cut rates in September. Current pricing shows a 96% chance.
Most of the damage was done last Thursday as US inflation came in below expectations. Headline inflation dropped 0.1% in June, below expectations of a 0.1% rise. The yearly figure was 3%, the lowest level in 12 months. Economists had been forecasting a drop to 3.1% from 3.3% in May. Core inflation also came in lower than expected at 3.3%, down from 3.4% in May and the lowest since April 2021.
GBP/USD
GBP/USD is seeing its strongest monthly performance since November last year. The bullish drive in the pair has been intact since the start of July as it attempts to breach the 1.30 mark for the first time in a year. The RSI has ventured into overbought territory but the appetite for further gains keeps the path of least resistance higher for the time being. This time last year when GBP/USD breached 1.3140 we saw the RSI push a little higher than the current level, suggesting we could see further bullish drive ahead.
Further weakness in the US dollar is likely to help the pair gather that last bit of drive needed to breach 1.30, which can be seen as a psychological resistance level. The calendar is going to be a busy one for the UK this week as CPI, employment, and retail sales are all lined up. Inflation is expected to have softened further in June but wages could continue to put upward pressure on prices, which would continue to limit the Bank of England’s ability to cut rates. Odds for an August rate cut currently stand at 50%. How these expectations evolve following the data will likely impact GBP/USD. For now, UK yields are slightly stronger than US yields, which plays in favour of GBP/USD
GBP/USD daily chart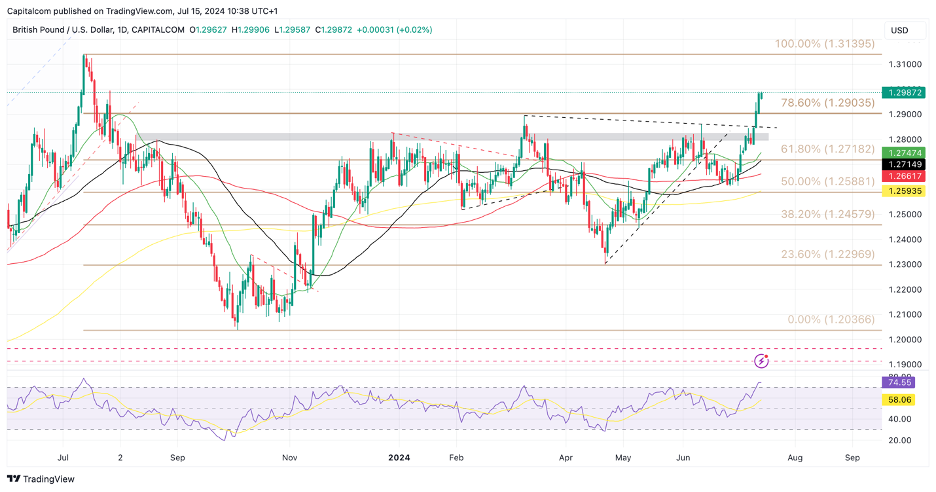
Past performance is not a reliable indicator of future results.
EUR/USD
EUR/USD is attempting to build the gains for a fourth straight session as resistance at 1.0915 becomes evident. The pair will need to breach and consolidate above this level to avoid falling into a double-top pattern which would reignite the bearish pullback. Beyond this level, further resistance could arise around 1.0945 before attempting to reach the 1.10 level for the first time since early January.
The moving averages are starting to reposition themselves in a bullish formation with the 50-day SMA crossing above the 100-day and 200-day SMAs and the 20-day SMA attempting to close the gap from below. Nonetheless, we may see buyers questioning the ability for further continuation given the extent of the rally over the past two weeks.
EUR/USD daily chart
Past performance is not a reliable indicator of future results.
USD/JPY
USD/JPY was holding up pretty well until Thursday when the June CPI data came in lower than expected. The Bank of Japan’s (BoJ) continuous dovish policy has meant the Japanese currency has been heavily sold against most majors as the carry trade has played against it. Even intervention in currency markets from Japanese officials has not been able to halt the devaluation of the yen over the past year, with the focus firmly on the BoJ as the only one who can stop it.
That said, markets have been cautious when trading around specific levels as the threat of intervention has limited the upside at times. The last time it happened was in April at the 160 level. For the past few weeks, buyers have been testing the appetite to push higher and have managed to break 160 without triggering another round of intervention, but the bullish momentum had started to fizzle out. Thursday’s data was the catalyst for that momentum to change and USD/JPY slipped back to its 50-day SMA currently at 157.83. This allowed the RSI to reset the overbought conditions, which could allow new buyers to come in.
Despite the recent weakness in the dollar, there is no real appetite to be a yen buyer right now, as Japanese policy continues to undermine the currency. Until we see decisive action from the BoJ to raise its policy rate USD/JPY will likely keep its bullish bias. For now, buyers seem to be interested in keeping the pair above 158.
USD/JPY daily chart
Past performance is not a reliable indicator of future results.
Disclaimer: This is for information and learning purposes only. The information provided does not constitute investment advice nor take into account the individual financial circumstances or objectives of any investor. Any information that may be provided relating to past performance is not a reliable indicator of future results or performance. Social media channels are not relevant for UK residents.
Spread bets and CFDs are complex instruments and come with a high risk of losing money rapidly due to leverage. 84.01% of retail investor accounts lose money when trading spread bets and CFDs with this provider. You should consider whether you understand how spread bets and CFDs work and whether you can afford to take the high risk of losing your money.
The information provided is not to be considered investment advice or investment research. Capital.com will not be liable for any losses from the use of the information provided.'
- English (USA)
- English (India)
- English (Canada)
- English (Australia)
- English (South Africa)
- English (Philippines)
- English (Nigeria)
- Deutsch
- Español (España)
- Español (México)
- Français
- Italiano
- Nederlands
- Português (Portugal)
- Polski
- Português (Brasil)
- Русский
- Türkçe
- العربية
- Ελληνικά
- Svenska
- Suomi
- עברית
- 日本語
- 한국어
- 简体中文
- 繁體中文
- Bahasa Indonesia
- Bahasa Melayu
- ไทย
- Tiếng Việt
- हिंदी
USD Latest: GBP/USD, EUR/USD, USD/JPY levels to watch
Published 15/07/2024, 11:30
USD Latest: GBP/USD, EUR/USD, USD/JPY levels to watch
Latest comments
Loading next article…
Install Our App
Risk Disclosure: Trading in financial instruments and/or cryptocurrencies involves high risks including the risk of losing some, or all, of your investment amount, and may not be suitable for all investors. Prices of cryptocurrencies are extremely volatile and may be affected by external factors such as financial, regulatory or political events. Trading on margin increases the financial risks.
Before deciding to trade in financial instrument or cryptocurrencies you should be fully informed of the risks and costs associated with trading the financial markets, carefully consider your investment objectives, level of experience, and risk appetite, and seek professional advice where needed.
Fusion Media would like to remind you that the data contained in this website is not necessarily real-time nor accurate. The data and prices on the website are not necessarily provided by any market or exchange, but may be provided by market makers, and so prices may not be accurate and may differ from the actual price at any given market, meaning prices are indicative and not appropriate for trading purposes. Fusion Media and any provider of the data contained in this website will not accept liability for any loss or damage as a result of your trading, or your reliance on the information contained within this website.
It is prohibited to use, store, reproduce, display, modify, transmit or distribute the data contained in this website without the explicit prior written permission of Fusion Media and/or the data provider. All intellectual property rights are reserved by the providers and/or the exchange providing the data contained in this website.
Fusion Media may be compensated by the advertisers that appear on the website, based on your interaction with the advertisements or advertisers.
© 2007-2025 - Fusion Media Limited. All Rights Reserved.