- Dollar surges after strong jobs data, defying earlier weakness.
- Key inflation data and Fed decision this week could determine dollar's direction.
- Euro has weakened against the resurgent dollar and risk appetite remains subdued.
- Invest like the big funds for under $9/month with our AI-powered ProPicks stock selection tool. Learn more here>>
The US dollar reversed course last week, shaking off earlier weakness and surging towards the 105 level on the back of positive employment data.
Optimism about a potential rate cut by the Federal Reserve (Fed) quickly faded as the nonfarm payrolls report came in significantly higher than expected, defying weaker leading indicators released earlier in the week.
While this put downward pressure on the stock market, the dollar's recovery trend, which began the previous week, continued unabated.
FX Markets Face Critical Week Ahead
This week promises another critical data event with the release of the Consumer Price Index (CPI) on Wednesday. This data, followed immediately by the Federal Reserve's interest rate decision, will significantly impact market volatility.
The contrasting data releases, with weak ADP data followed by strong Nonfarm Payrolls, have been mixed. While expectations of robust US employment solidified, the rising unemployment rate presents another data point leaving investors uncertain.
This week's CPI release could provide some clarity. A higher-than-expected CPI could prompt a cautious statement from the Fed, potentially bolstering the dollar's appeal as a safe haven asset. Conversely, lower-than-expected CPI would ease pressure on the Fed, potentially paving the way for a future rate cut.
The Fed initially anticipated three rate cuts in 2024, but current forecasts suggest only one. The exact timing of this cut remains speculative and will significantly impact markets.
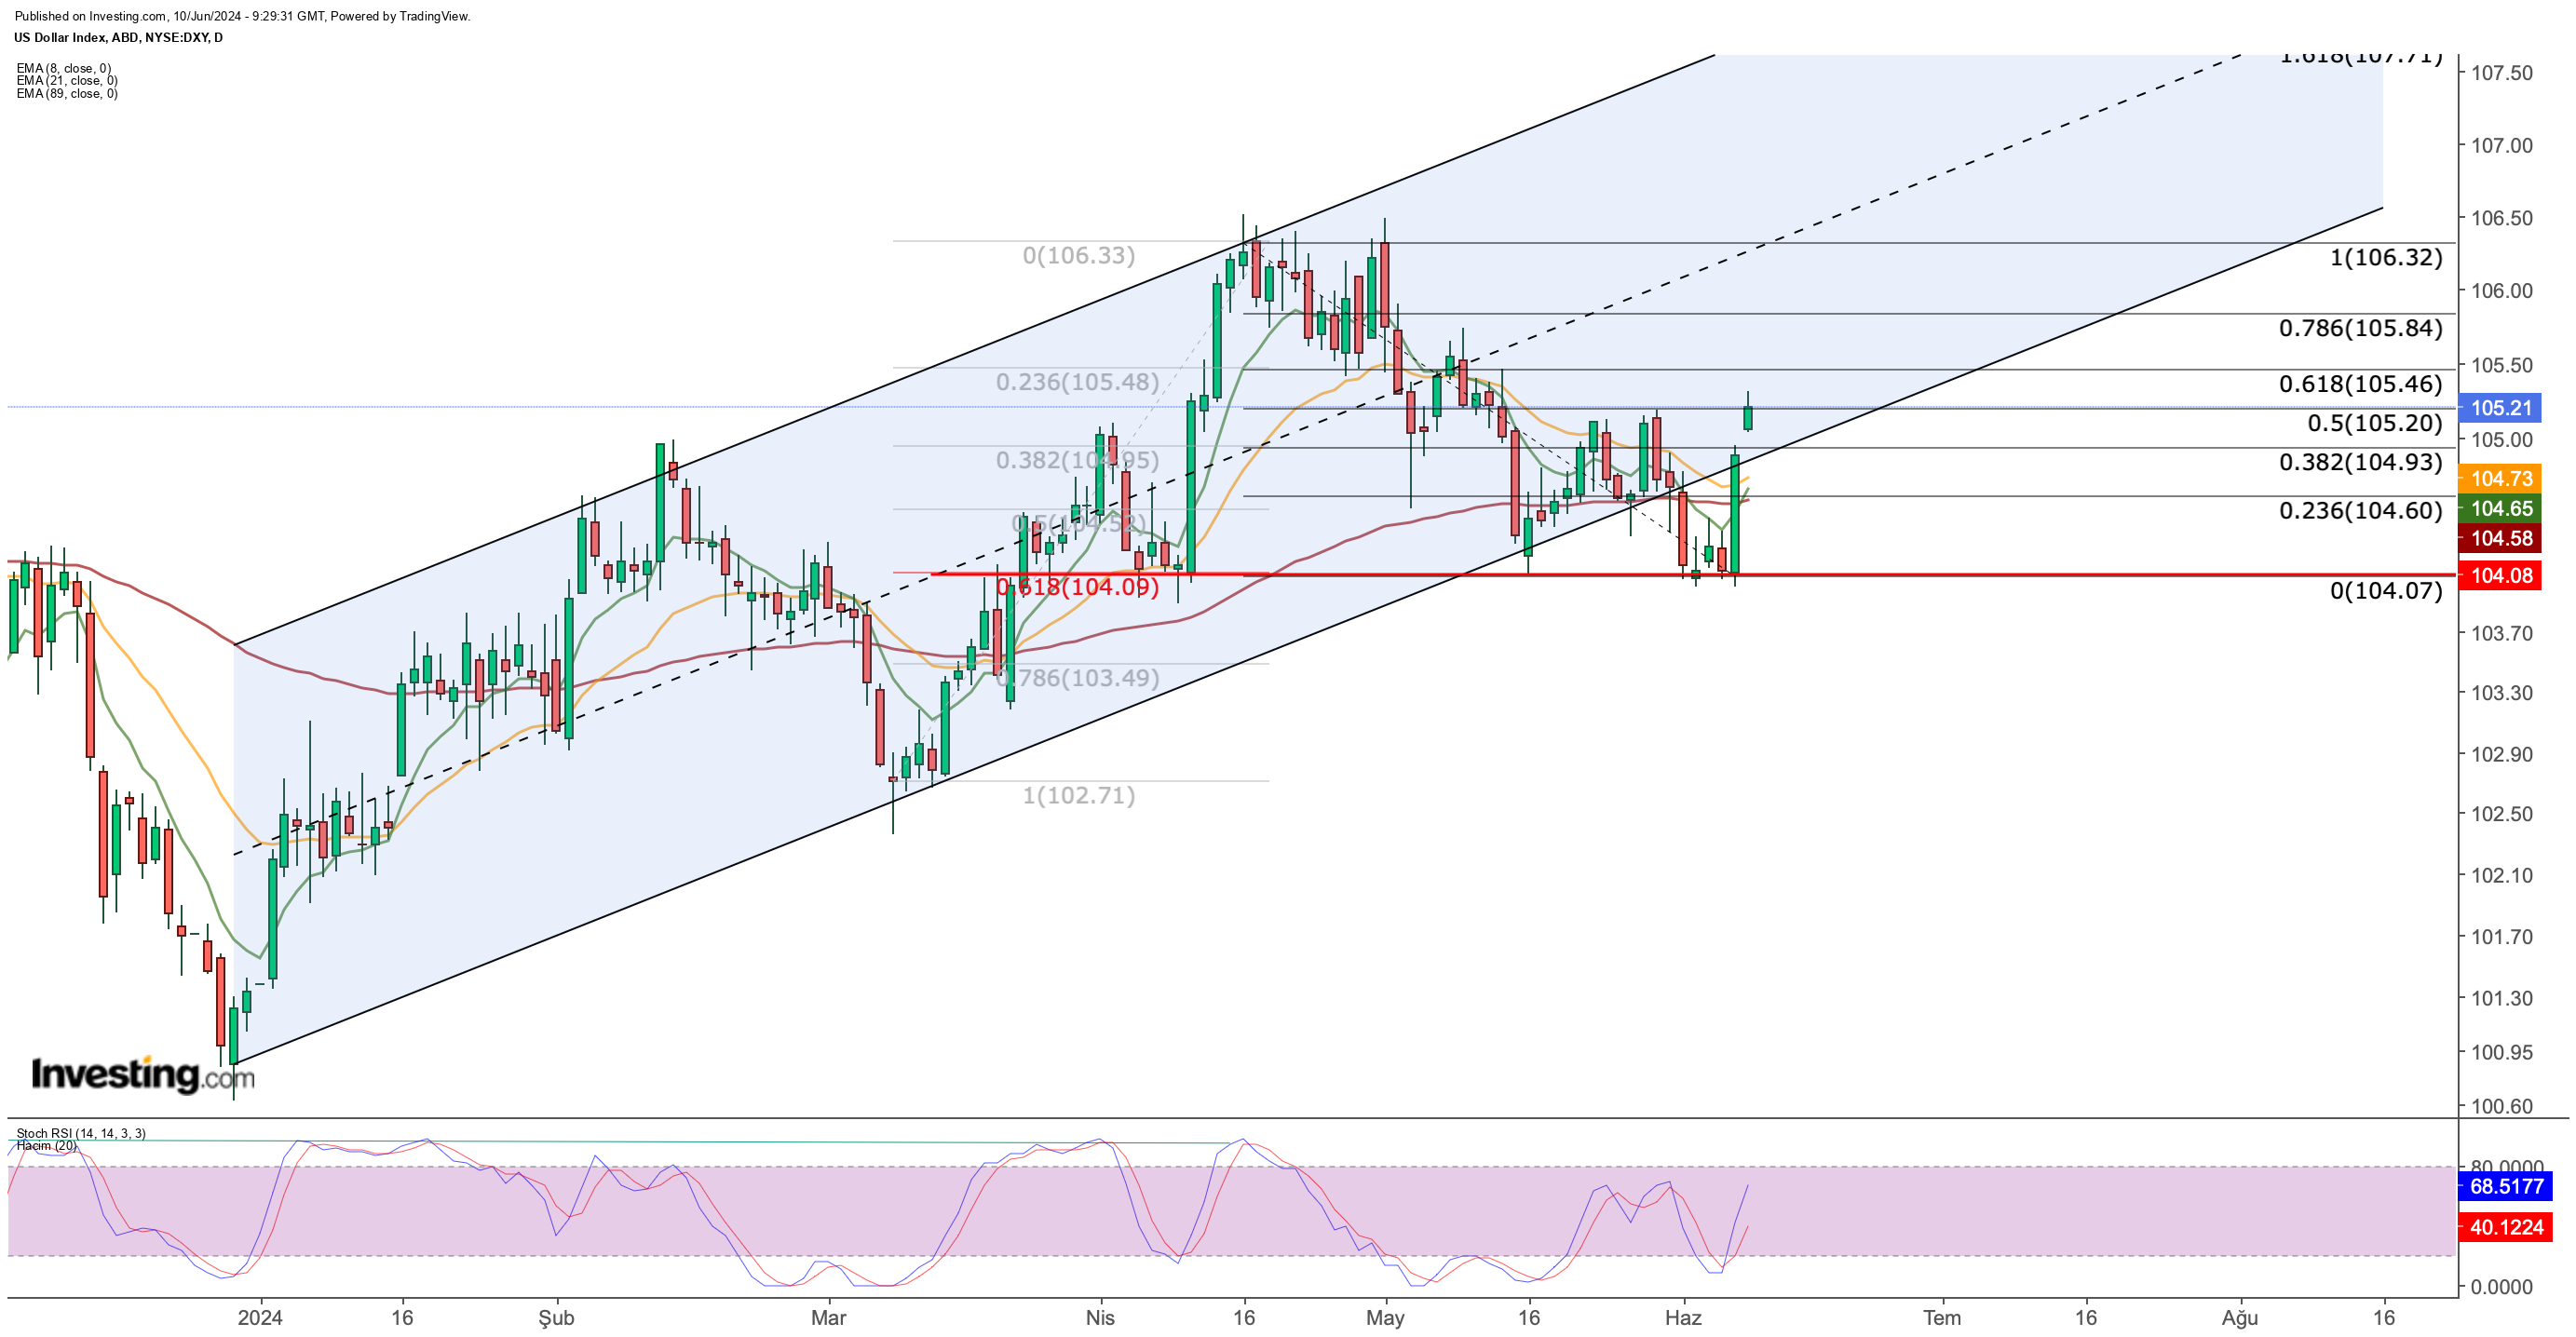
The week began with subdued risk appetite due to the lingering effects of the employment data. The dollar maintained its positive momentum against other major currencies, pushing towards the 105 level on the DXY.
This week's economic data, particularly the CPI and Fed decision, will be crucial in determining the dollar's near-term trajectory and providing further clues about the Fed's future monetary policy actions.

The recent rally pushed the DXY (Dollar Index) back towards its rising channel, signaling a potential end to the April-May correction. Interestingly, the rebound found support right at the ideal Fibonacci retracement level of 0.618.
This week's data and overall market sentiment will be crucial. If risk appetite weakens, the DXY could surge towards target levels of 105.5, 105.85, and even 106.3.
Technically, the DXY's climb above May's resistance further strengthens the bullish case. However, if a pullback occurs, the first support to watch is at 104.9.
On the other hand, an optimistic market environment could see dollar demand decrease. In that scenario, a retreat below the main support of 104 and down to the 103.5 region becomes a possibility.
Euro Tumbles as Dollar Demand Soars
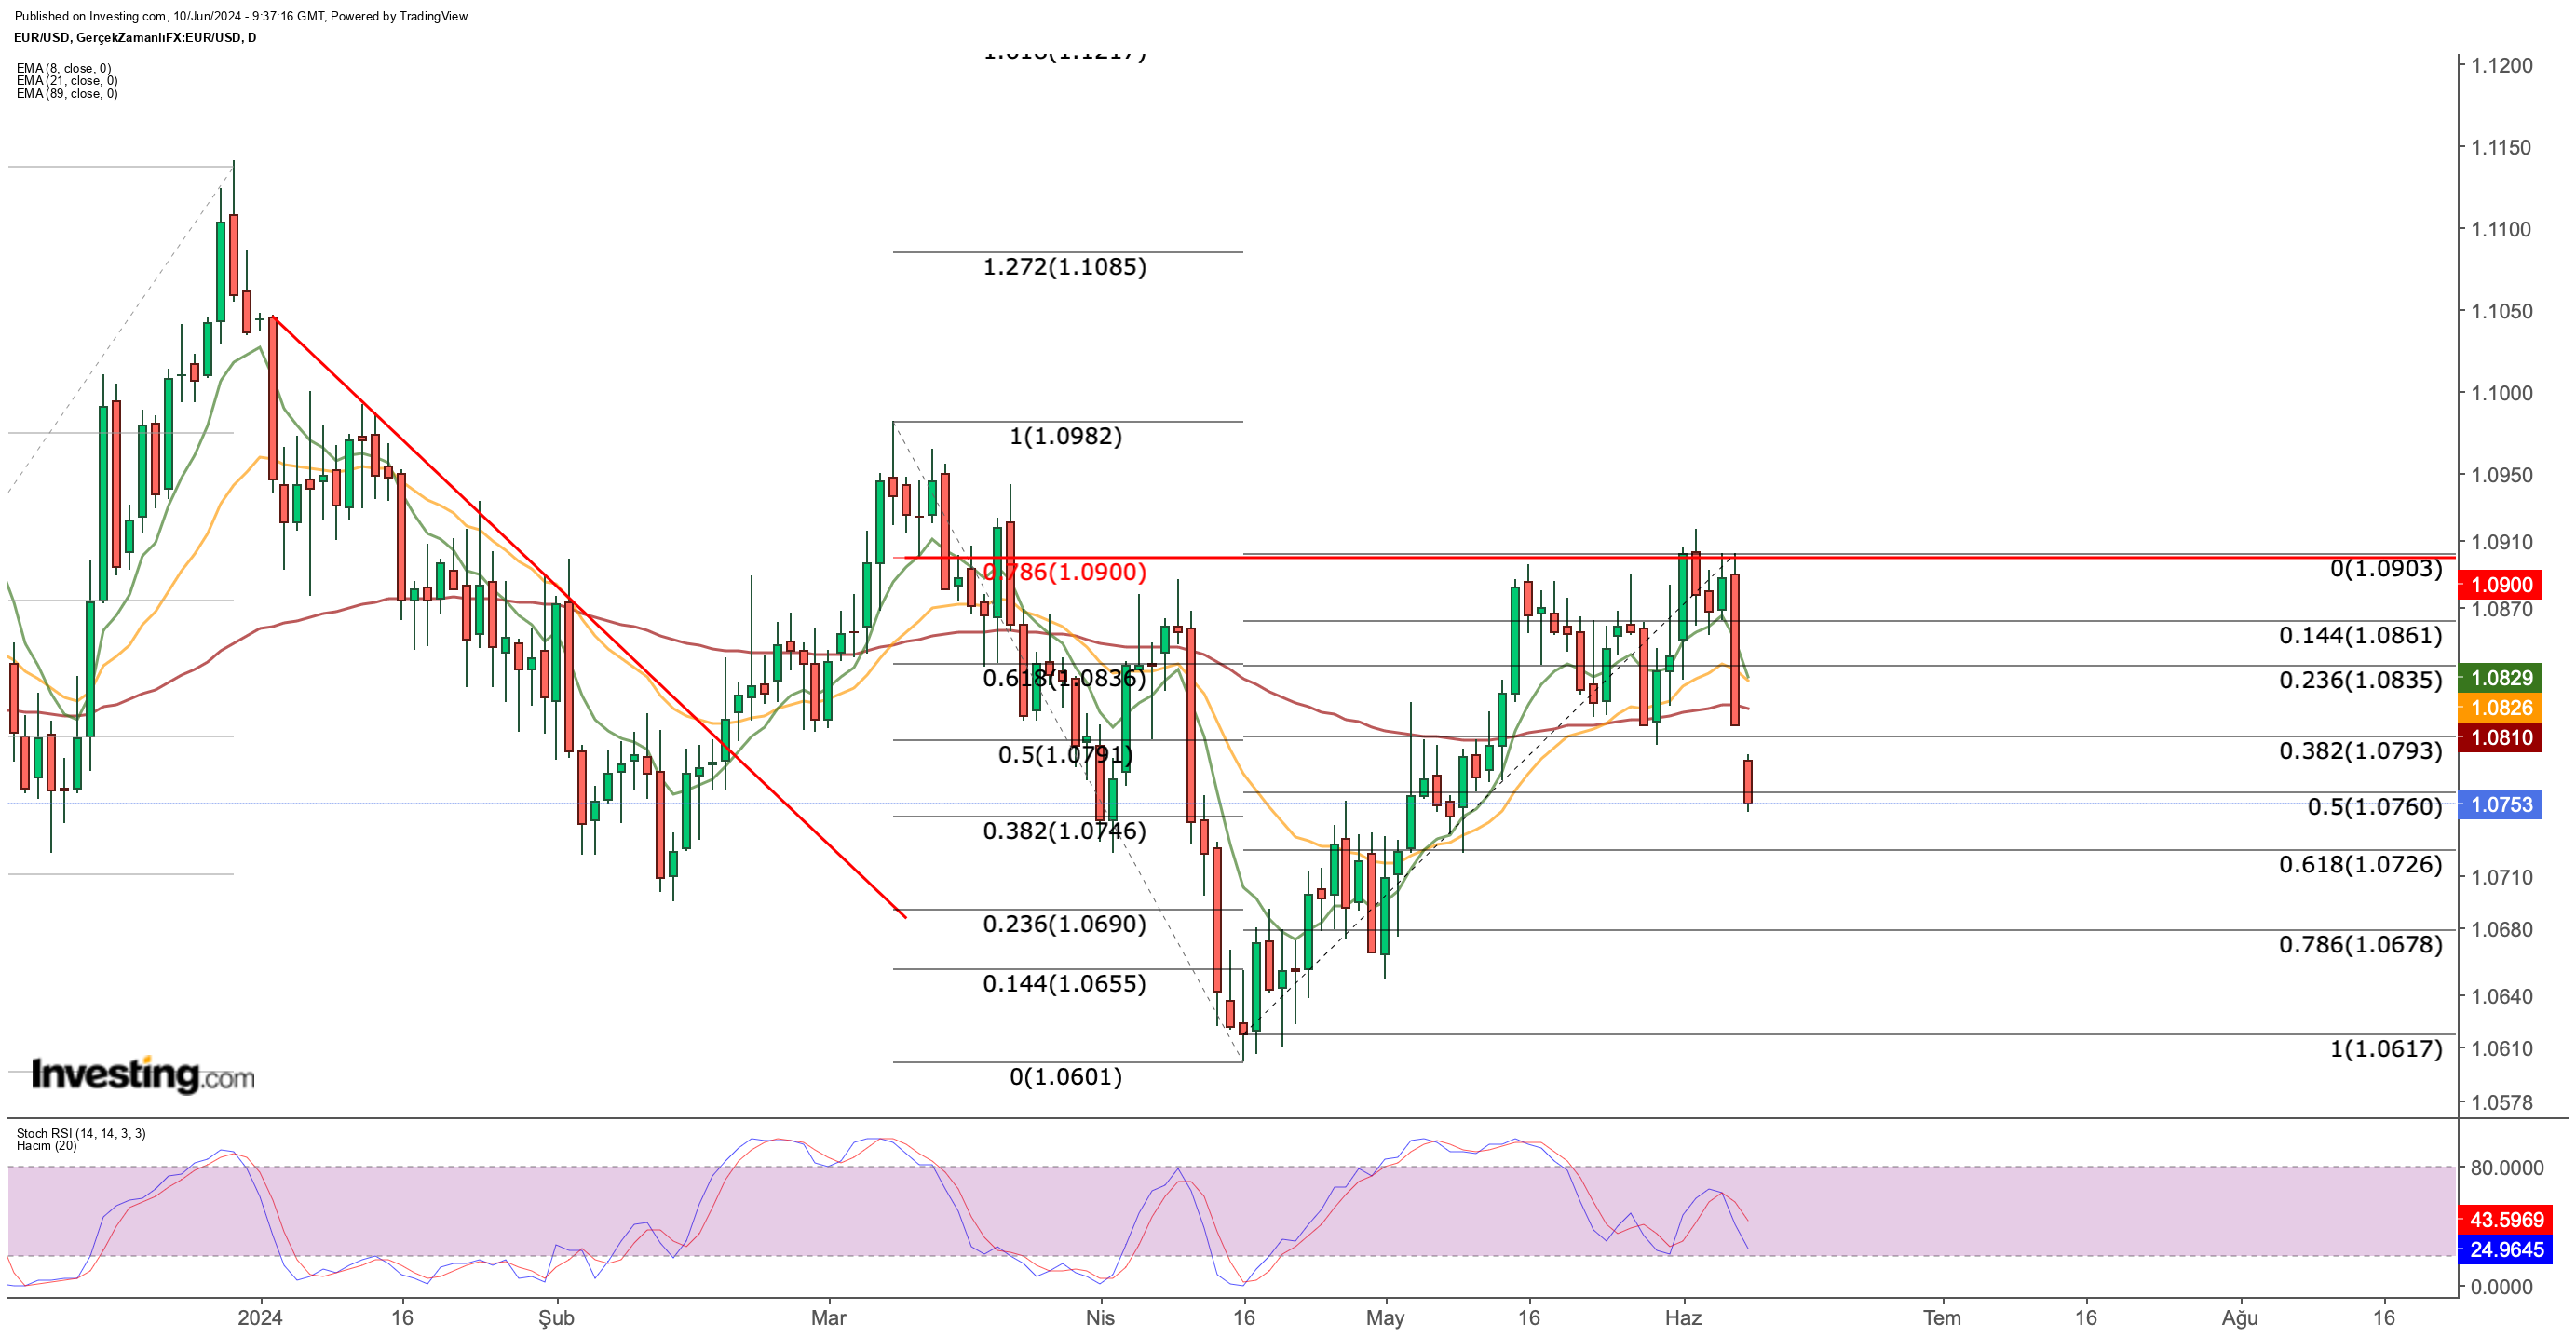
The Eurozone's interest rate cut failed to lift the EUR/USD pair. The resistance at 1.09 held firm, and strong dollar demand fueled by Friday's data pushed the pair towards the 1.07 zone.
Adding pressure, the upcoming European Parliament elections and French President Macron's decision for early elections are creating uncertainty in the market.

EUR/USD began the week below the 1.08 support level. The next key support to watch is 1.0725. If this level breaks, the pair could plunge as low as 1.068 this week. With the recent test of monthly lows, the outlook for EUR/USD remains firmly negative.
Gold Seeks Support Below $2,300
Rising dollar demand also weighed on the precious metals market. Gold tumbled sharply below its support at $2,325, which had held since late May. The price briefly paused around $2,290, a level that previously provided support in April.
The yellow metal has been on a downtrend since mid-May. However, a potential reversal could be brewing at a stronger support zone around $2,260. This level coincides with the 3-month EMA (Exponential Moving Average) and the Fibonacci retracement level of 0.382, making it a technically significant support line.
While continued dollar strength could push gold down to $2,260, buyers emerging at this level could signal a reversal. Interestingly, the Stochastic RSI indicator on the daily chart has been in oversold territory for a while. If gold can establish a new floor above $2,325, it could trigger bullish signals.
***
Take your investing game to the next level in 2024 with ProPicks
Institutions and billionaire investors worldwide are already well ahead of the game when it comes to AI-powered investing, extensively using, customizing, and developing it to bulk up their returns and minimize losses.
Now, InvestingPro users can do just the same from the comfort of their own homes with our new flagship AI-powered stock-picking tool: ProPicks.
With our six strategies, including the flagship "Tech Titans," which outperformed the market by a lofty 1,745% over the last decade, investors have the best selection of stocks in the market at the tip of their fingers every month.
Subscribe here and never miss a bull market again!

Don't forget your free gift! Use coupon codes OAPRO1 and OAPRO2 at checkout to claim an extra 10% off on the Pro yearly and bi-yearly plans.
Disclaimer: This article is written for informational purposes only; it does not constitute a solicitation, offer, advice, or recommendation to invest as such it is not intended to incentivize the purchase of assets in any way. I would like to remind you that any type of asset, is evaluated from multiple points of view and is highly risky and therefore, any investment decision and the associated risk remains with the investor.
