The first half of May has seen market volatility return. Tech shares and high-growth names have especially come under pressure. Investors worried about the next market downturn may wonder if there are ETFs suitable for choppy or down markets.
Wall Street offers several funds to help hedge portfolios that could fit different investing styles and risk profiles. Today's article introduces two such ETFs.
1. Legg Mason Low Volatility High Dividend ETF
- Current Price: $37.0
- 52-Week Range: $25.18 - $37.49
- Dividend Yield: 3.16%
- Expense Ratio: 0.27% per year
While markets get more jittery, investors look for stable yields. Low-interest rates mean finding robust passive-income investments is not always easy. Increased volatility complicates the equation further.
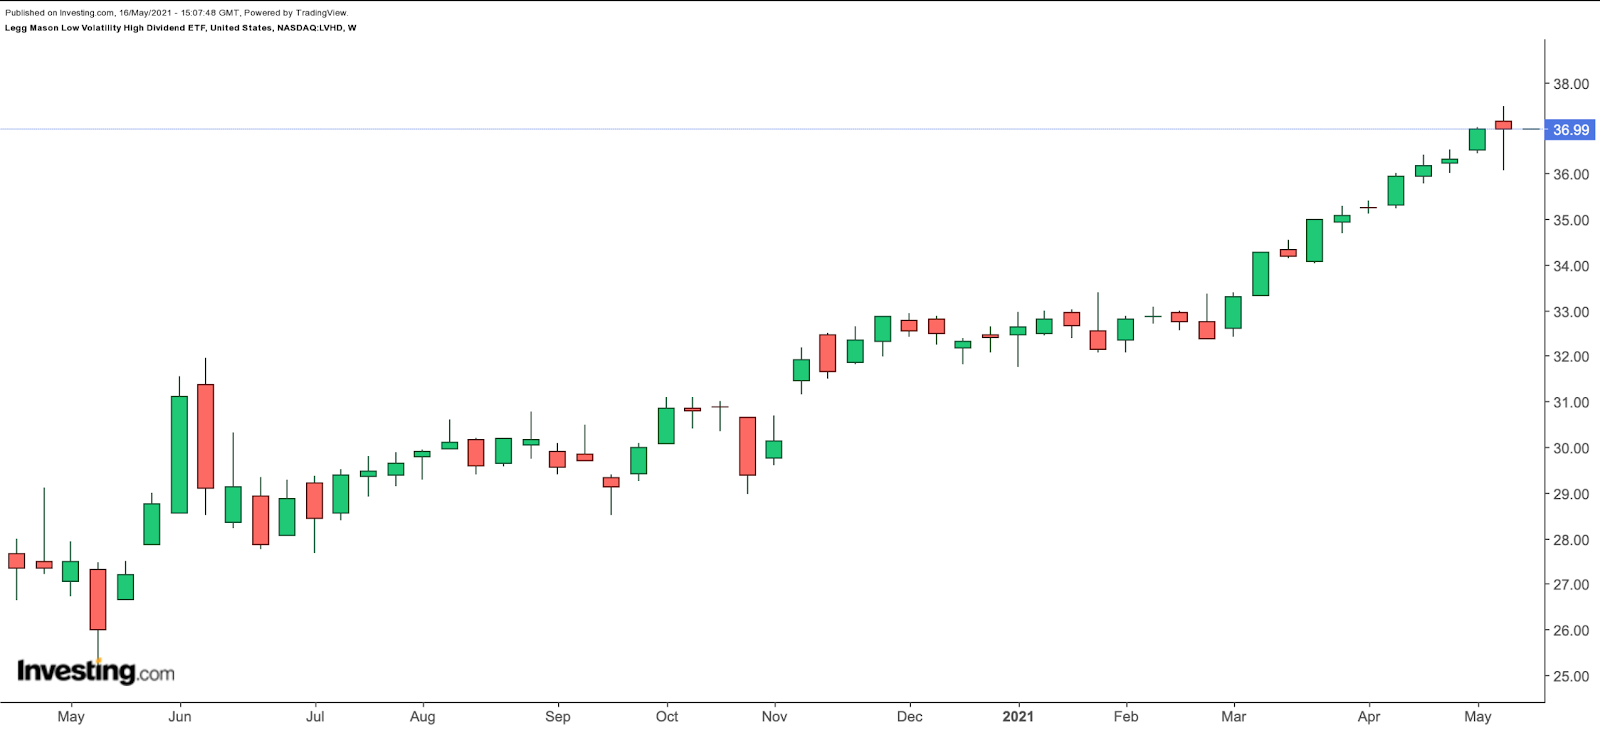
Our first fund, the Legg Mason Low Volatility High Dividend ETF (NASDAQ:LVHD), could appeal to a range of investors. This low volatility ETF, which started trading in December 2015, might help smooth the ride even when markets are down.

LVHD's benchmark index is the Solactive US Broad Market Index. Fund managers screen for profitable companies that pay sustainable and relatively high dividends. No individual sector exceeds a 25%-weighting.
The fund currently has 77 stocks, and the slice of no individual company is over 3.0%. The top sector allocation is consumer staples (23.51%), followed by real estate (14.12%), utilities (14.03%), health care (13.41%), industrials (13.37%), information technology (8.08%), and others.
The fund's top ten holdings constitute over 27% of net assets, which stand around $740 million. Leading names in the roster include Seagate Technology (NASDAQ:STX), Philip Morris International (NYSE:PM), Eaton Corporation (NYSE:ETN), Emerson Electric (NYSE:EMR), Colgate-Palmolive (NYSE:CL), Johnson & Johnson (NYSE:JNJ) and General Motors (NYSE:GM).
So far in the year, LVHD is up 14% and hit a record high on May 10. We like the diversity of the fund and believe it could be a suitable instrument for passive dividend seekers. Interested investors should consider doing further due diligence.
2. Global X NASDAQ 100 Covered Call ETF
- Current Price: $22.04
- 52-Week Range: $20.20 - $23.58
- Distribution Yield: 12.89%
- Expense Ratio: 0.60% per year
In the search for yield, another niche area that gets increased attention is covered call ETFs. In recent months, we discussed numerous covered call examples with stocks (for example, here, here, here, and here).
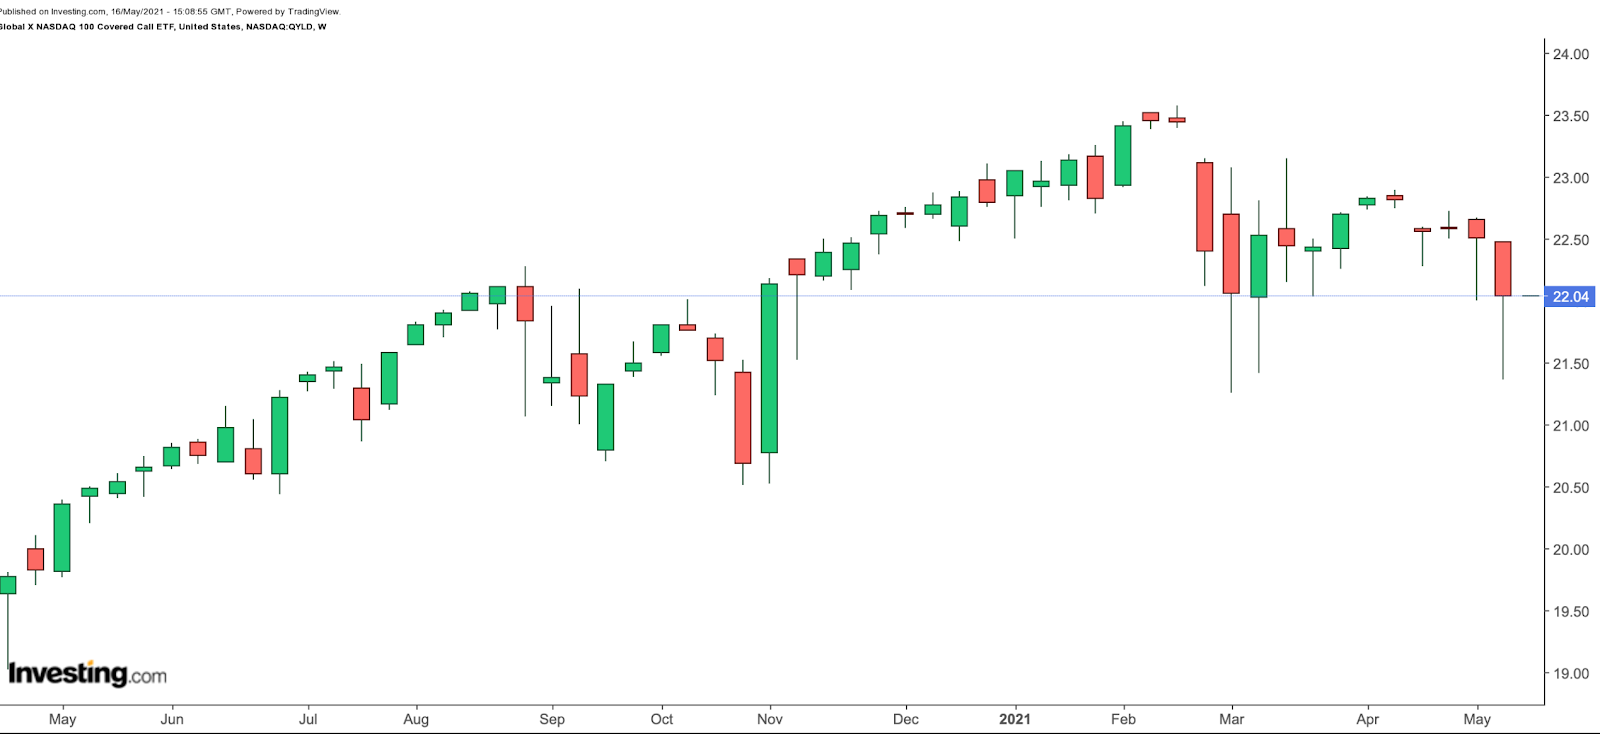
The Global X NASDAQ 100 Covered Call ETF (NASDAQ:QYLD) follows a “covered call” or “buy-write” strategy, whereby it first buys all the stocks in the NASDAQ 100. QYLD “writes” or “sells” monthly at-the-money index call options. The fund’s aim is to generate income through covered call writing, which typically produces higher yields in periods of heightened volatility.
Single stock options and index options have several differences, which the fund’s management highlights. For example, single stock options can be exercised at any time. But index options cannot be called/exercised early. They are also settled in cash, not in delivering the underlying index holdings.
Since index options cannot be called early, where the index finishes the month is the most important thing for an investor. All the price swings that may happen throughout the month are irrelevant.
QYLD, which tracks the CBOE NASDAQ 100 BuyWrite V2 Index, started trading in December 2013. The top ten names comprise around 55% of the total net assets, which are around $2.7 billion.
Its top five companies are Apple (NASDAQ:AAPL), Amazon (NASDAQ:AMZN), Microsoft (NASDAQ:MSFT), Facebook (NASDAQ:FB) and Alphabet (NASDAQ:GOOGL) (NASDAQ:GOOG).
Year-to-date, the NASDAQ 100 index and Invesco QQQ Trust (NASDAQ:QQQ) are up around 3.5% and 4% respectively.
However, QYLD, which invests in the same securities as QQQ, but then sells covered call options on the entirety of the holdings, is down about 3% YTD. But QYLD's 12-month distribution yield stands at 12.89% and this is the yield an investor would have typically received if they held the fund over that period. The fund makes payments monthly.
When an ETF, such as QYLD, sells a call option, it collects a premium from the option buyer. It's these premiums that allow the fund to pay out additional income. At the end of the month, QYLD seeks to distribute a portion of the income from writing/selling the NDX index option to the ETF shareholders and at the beginning of each new month, this process is repeated.
Thus the premium provides income in sideways markets and offers limited protection in declining markets.
However, investors should note that covered calls limit an ETF's gains in a rising market. For example, although the NASDAQ 100 index has gone up about 47.2% over the last 12 months, QYLD increased by 7.7%. But in addition, it had the distribution yield of 12.89%.
The calls written every month have by definition capped the returns of QYLD. With covered call ETFs, in exchange for receiving the premium now, investors give up potential upside later, a fact highlighted in the fund's prospectus. QYLD has given up the profit potential in the months the index has risen above the strike price of the index call option.
Like any other asset class or fund, QYLD’s risk/return profile may not be appropriate for all investors. However, the ETF is likely to be of interest to retirees and income investors, who may be ready to sacrifice upside potential in exchange for more regular monthly distributions.
