Market Overview
You can imagine President Trump looking at himself in the mirror and saying, “I did that” as Wall Street rebounded yesterday. Trump has suggested that China is desperate for a trade deal and one could come “sooner than you think”. There is nothing overly insightful in that statement. Something that is consistent with where we are at in the cycle of this trade dispute (playing up the prospects of a deal before the next round of negotiations). But it is astounding that markets reacted so positively to this. Perhaps there is also a sense that the impeachment prospects took a hit as Trump released a transcript of a call with the Ukrainian president. The call was deemed not to contain the smoking gun the Democrats would have hoped for. Subsequently, yields have jumped and the dollar too.
The question is whether traders now run with this sentiment improvement. Initial signs are cautious again this morning. No game changers of any substance and perhaps in the cold light of day traders are sceptical that the trade dispute can improve in any sustainable manner. Recent trends of risk aversion have certainly taken a hit but, for now remain on track. The reaction of gold and the yen will certainly be worth watching, whilst equities were turning increasingly corrective until yesterday’s shot in the arm for risk appetite. This morning, the sustainability of that influx looks shaky but will define the outlook of these trends which remain intact, for now.
Wall Street closed higher last night with the S&P 500 +0.6% (at 2985). However, US futures look tentative today -0.1% and Asian markets are also very cautious (Nikkei +0.1%, Shanghai Composite -0.5%). European markets also look cautious with the FTSE futures -0.1% and DAX futures also -0.1%. In forex there is a mild retracement of yesterday’s USD strength, with a mild underperformance of AUD being an exception.
In commodities, the corrective momentum built on gold yesterday has looked to also unwind whilst oil remains under pressure.
It is another day for the US on the economic calendar. The final reading of US GDP for Q2 is at 13:30 BST which is expected to be confirmed at +2.0% (+2.0% in the prelim reading for Q2, Q1 at +3.1%). Initial Jobless Claims are at 1330BST and are expected to show numbers again around recent levels, at 212,000 (a shade up from 208,000 last week). Pending Home Sales at 1500BST are expected to grow by +0.9% in August (-2.5% in July).
Central bankers are again in focus, with ECB President Draghi speaking in one of his final engagements at 14:30 BST. The Bank of England’s Mark Carney speaks at the same event but at 14:45 BST. Arch dove on FOMC James Bullard is speaking at 15:00 BST, just to remind, Bullard was the dissenter on the voting that wanted -50bps in the last Fed meeting.
Chart of the Day – DAX Xetra
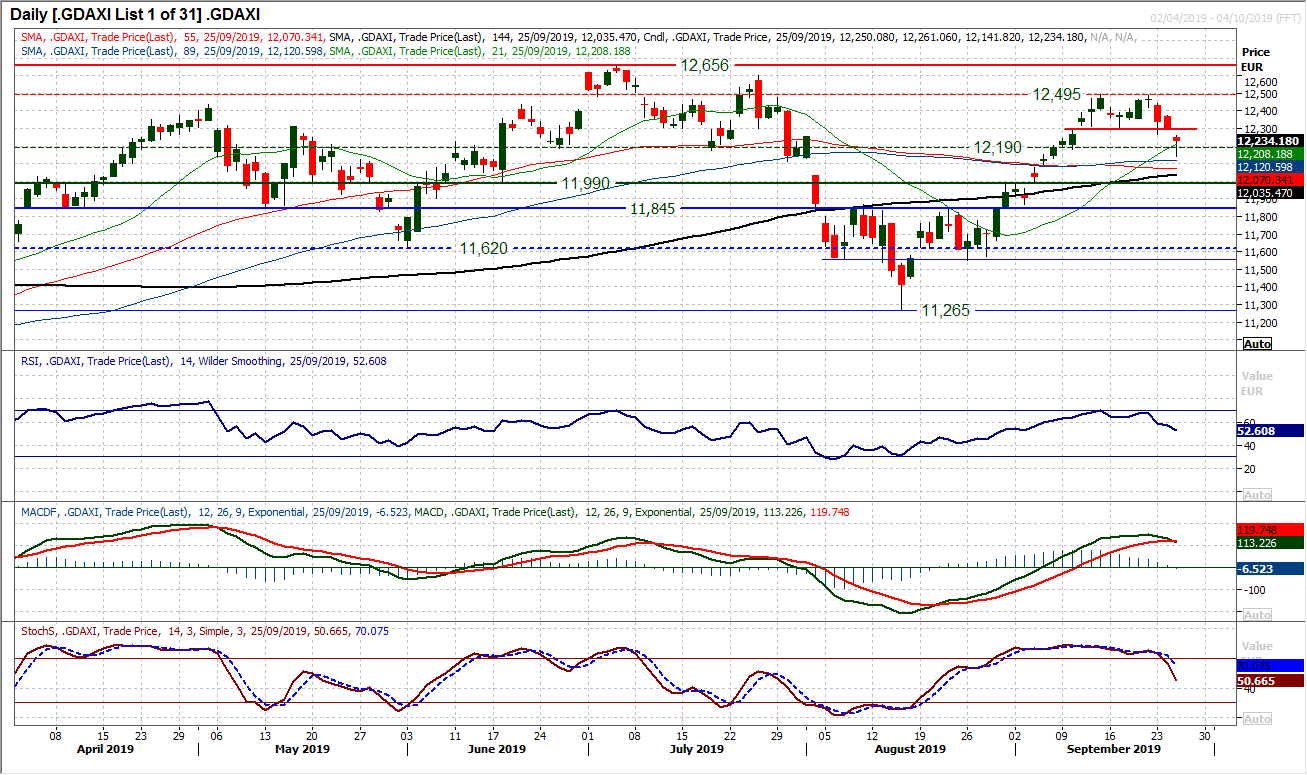
Sentiment across equities has turned a little sour in the past few days, and this is especially the case with the DAX. The German market has seen three negative closes in a row now. The uptrend recovery which added 10.9% through August into September has posted three successive bear candles and momentum is building for a correction. The initial support at 12,300 being breached on a gap lower yesterday effectively completed a small 200 tick top pattern (implying 12,100). More importantly now though there is little real support until 11,990. The deterioration is flowing through momentum indicators too now, with bear crosses on Stochastics and MACD lines accelerating lower, whilst the RSI is now below 50 too. A rebound into the close (on Trump’s trade comments) leaves the market interestingly poised today. The technical outlook suggests a market under pressure and rallies as a chance to sell. There is a gap open at 12,307 and the fear is that this could be a “breakaway gap” that the market struggles to fill (at least during this growing corrective phase). Yesterday’s high at 12,261 is initial resistance and a failure of yesterday’s rally could usher in a growing corrective phase. There is now a resistance band of around 50 ticks 12,260/12,310 that needs to be watched. Another negative candlestick today would open for a correction back into the support band 11,845/11,990.
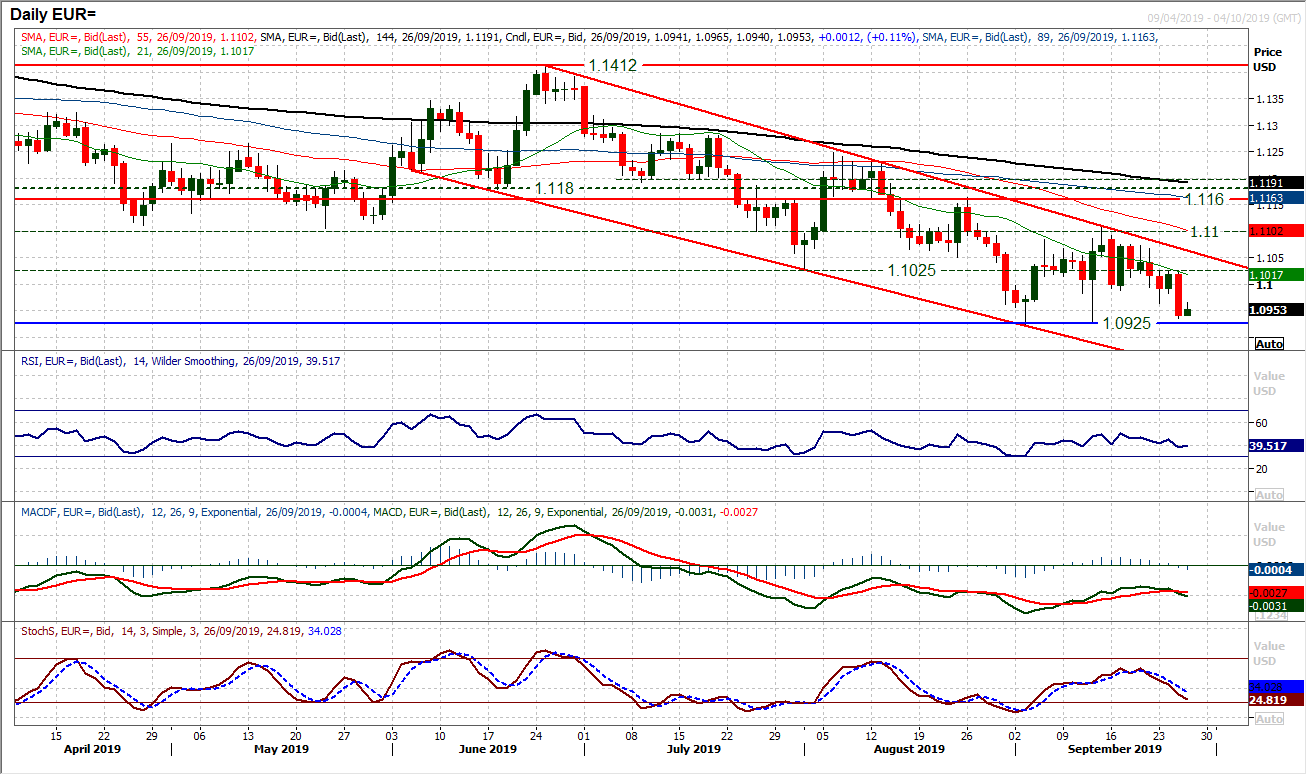
The euro remains under pressure as another strong bear candle formed yesterday. The bears will now be eyeing a test of the key support $1.0925. However, already we see the euro has closed at its lowest level since May 2017 and means that $1.0850 is the next basis of realistic support. Rallies within the downtrend channel remain a chance to sell. This price action this week has left resistance at $1.1025 which was an old key low and adds strength to the resistance for the medium term that is building between $1.0990/$1.1110. Momentum remains strongly negative but with further downside potential too. The RSI have only just fallen into the 30s again, Stochastics falling and MACD lines just bear crossed again. The hourly chart shows the overnight rebound struggling around the previous $1.0965 low this morning. Below $1.0925 really does open the downside once more.
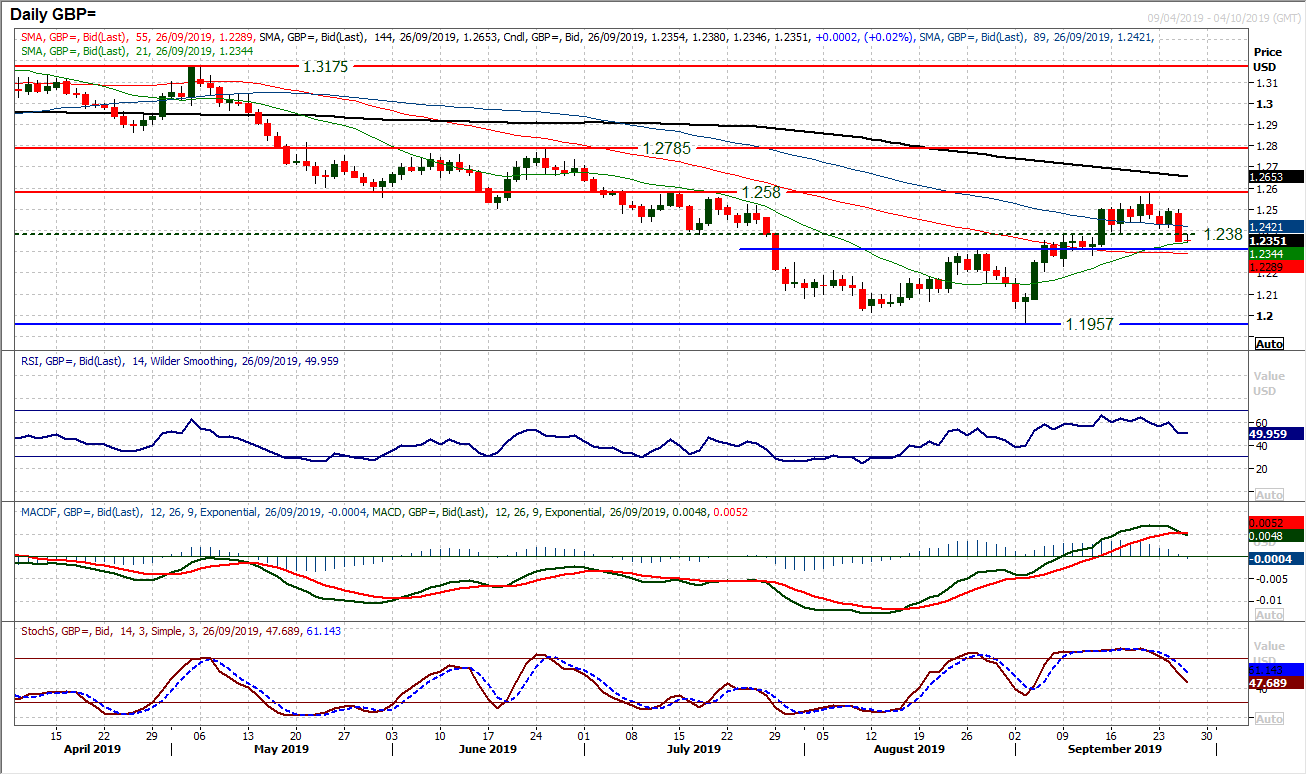
Sterling was not alone in suffering a hit against the dollar yesterday, but Cable has now decisively lost its recovery momentum and is under growing threat of a reversal. The support band $1.2305/$1.2380 is now key. A breakout above a $1.2305 neckline completed a base pattern in early September, but a failure back below would be a significant disappointment for the bulls now. A close below $1.2230 would be a signal for a renewed corrective momentum now. How the bulls react in the next day or so could be crucial. There is a confirmed bear cross on Stochastics (which is a signal for profit taking), the MACD lines are also in the process of bear crossing. However, this is not terminal for the recovery quite yet. The bulls reacting by closing above $1.2380 again would be a positive response. This is a basis of resistance now and if it can be breached it will be a sign of fight from the bulls. More considerable resistance is now at $1.2500 but the bulls need a response today otherwise a correction could begin to take hold decisively.
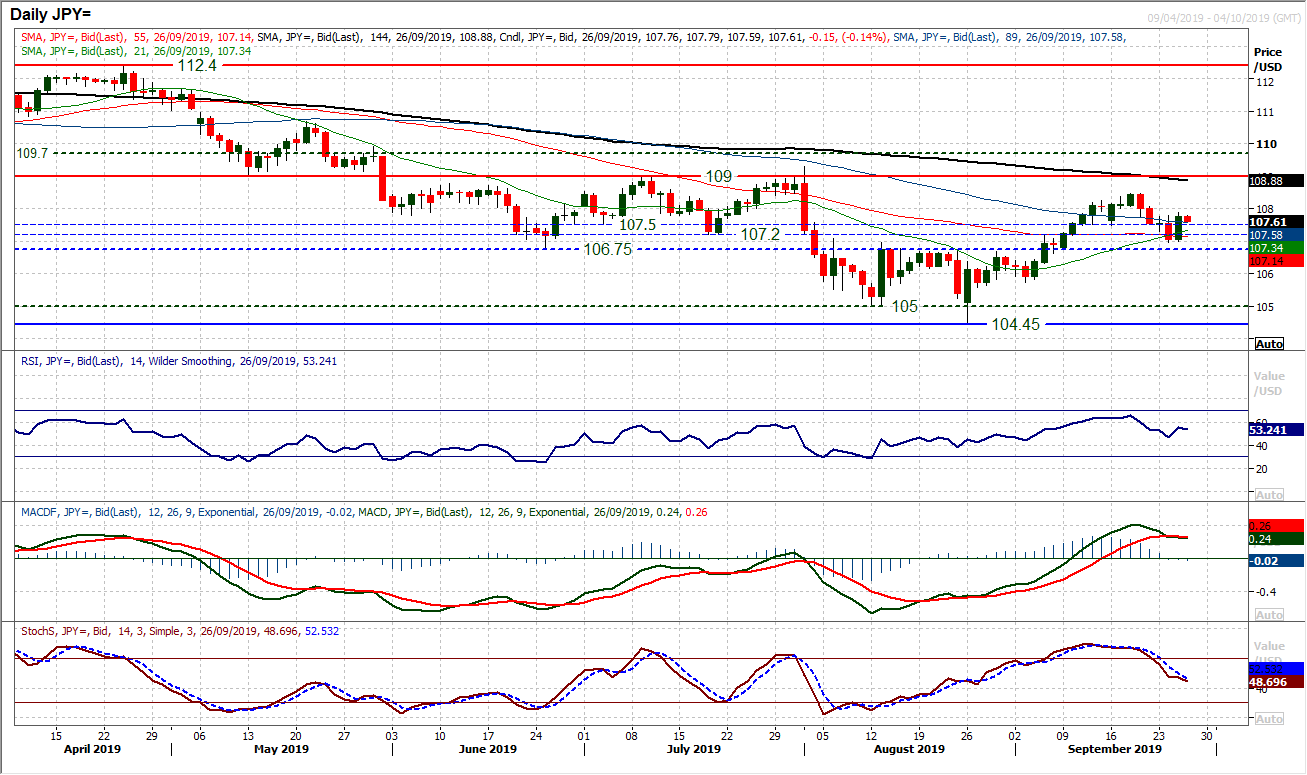
The corrective momentum of the past few sessions was stopped in its tracks following Trump’s suggesting that a deal with China may come sooner than expected. Renewed appetite for risk has hit the yen and a strong bull candle added 70 pips into the close. This has now left support at Tuesday’s low of 106.95. The hourly chart shows an improvement in technical outlook, but this is a move that needs to be sustained and built upon for the bulls to regain their jolted confidence. However, the hourly chart shows resistance around 107.75/108.00 which needs to be breached. So this barrier is still a factor. Daily momentum indicators have stabilised in their slide rather than posting any decisive positive signals. So more needs to be seen from the bulls to convince. An instant rejection of the rebound and a move back below 107.50 (the top of the 106.75/107.50 pivot support would suggest the bulls are struggling to find the traction again. The main resistance is still 108.47.
Gold
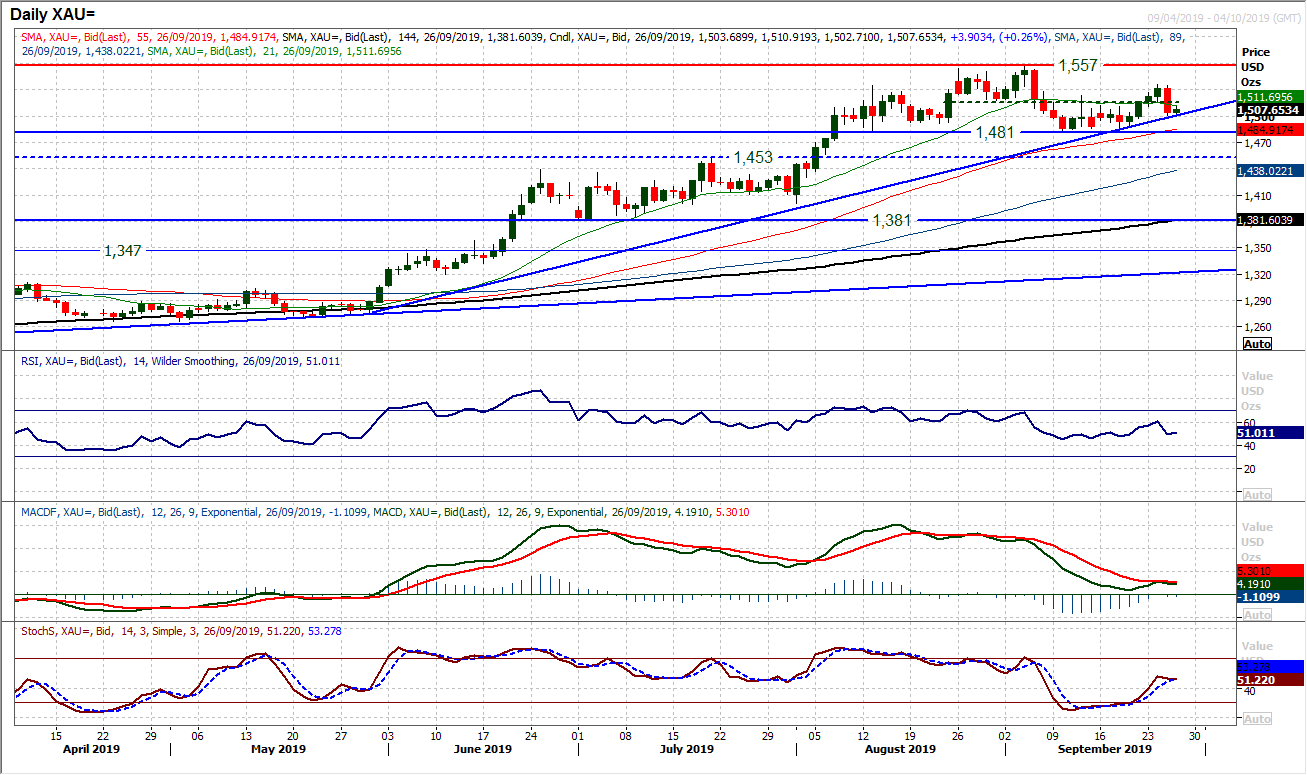
Risk appetite has been bolstered from Trump’s latest update on the prospects of a China deal. This has hit the rally on gold again, but not decisively, yet. A move back below $1517 which is effectively a mid-range pivot of $1481/$1557 was a disappointment for the bulls and lends a negative configuration to the range once more. A run of four positive candles have been ended by yesterday’s strong bear candle and a redrawn four month uptrend is being tested (today c. $1500). Having turned lower to leave resistance at $1535 with a close back under $1517 has taken the impetus out of the bull reaction and seems to be a move that re-iterates this as a growing medium term range (now around 7 week old). Another close back under $1517 with a negative candle today would keep the pressure on the uptrend, but also the $1481/$1484 support band comes back into play. Momentum indicators are increasingly reflective of a range play, meaning that the trend is likely to be breached, but whilst $1481 is intact we remain medium to longer term positive on gold. The hourly chart shows initial resistance at $1511/$1517.
WTI Oil
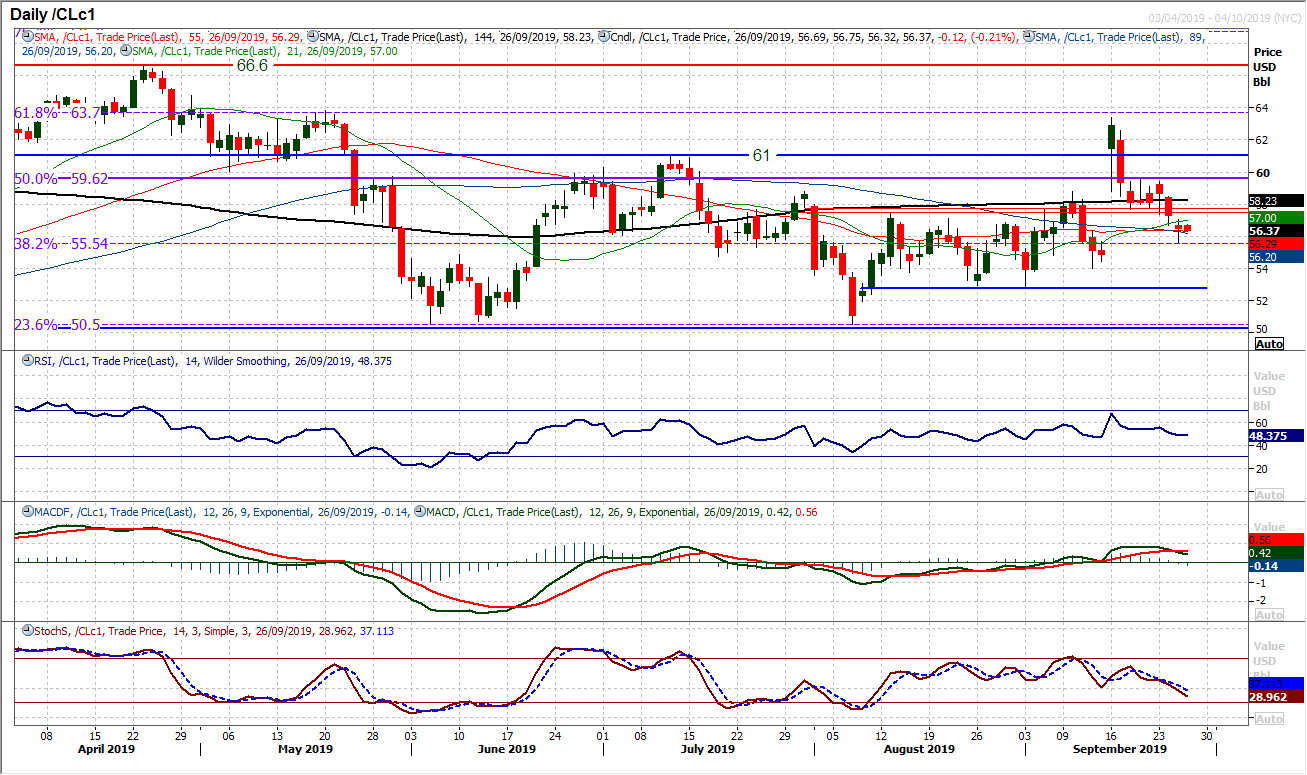
It is interesting that aside from the one session where oil spiked higher on the Saudi refinery attacks, all the candlesticks since 10th September have been negative. It reflects an ongoing failure of the bulls to control the market. Intraday rallies are consistently being sold into. It is on the Stochastics which this is reflected the most prominently. Another bear candle yesterday has brought the market back to the 38.2% Fibonacci retracement at $55.55 again. It has also left resistance of a pivot in the $57.50/$57.75 range. The decline has also now filled the massive gap from 16th September too. A close under $55.55 opens $54.00 support. With downside pressure on, near term rallies are a chance to sell.
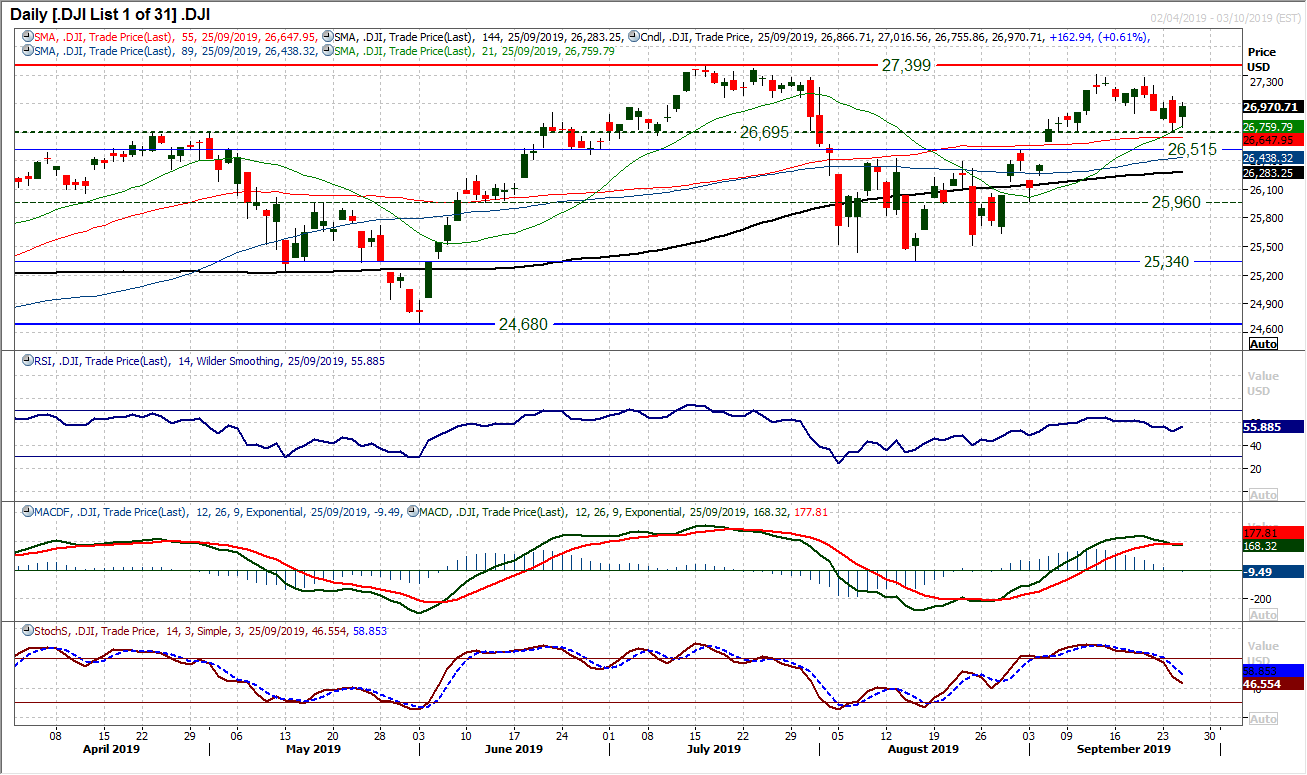
Wall Street reacted positively to Trump’s assessment that a deal with China could happen “sooner than you think”. The Dow has picked up strongly from Tuesday’s low at 26,705 (which has strengthened the support band 26,515/26,695) to leave a positive candle yesterday. With momentum indicators beginning to deteriorate in recent days, this is will come as welcome relief for the bulls. However, there needs to be a continuation of this move today in order to suggest the corrective slip of the past two weeks has played out. The resistance of 27,080 (Tuesday’s high) needs to be breached to end a run of lower highs. We still see this as being a near term correction which the bulls should support, and so the run of lower highs needs to be broken to end the near term correction.
"""DISCLAIMER: This report does not constitute personal investment advice, nor does it take into account the individual financial circumstances or objectives of the clients who receive it. All information and research produced by Hantec Markets is intended to be general in nature; it does not constitute a recommendation or offer for the purchase or sale of any financial instrument, nor should it be construed as such.
All of the views or suggestions within this report are those solely and exclusively of the author, and accurately reflect his personal views about any and all of the subject instruments and are presented to the best of the author’s knowledge. Any person relying on this report to undertake trading does so entirely at his/her own risk and Hantec Markets does not accept any liability. """
