The "Halloween Indicator" is a market timing strategy that suggests that stock market returns are higher in the winter months—November through April.
The old stock market adage "Sell in May and go away" holds that stock returns are more muted May through October.
Both strategies are cited in one of the hotly contested debates on the Street. Does the six-months-on, six-months-off seasonal pattern hold true? And if so, what are the driving factors and exact duration? Finally, how do these principles stand up against the hypothesis that markets are efficient?
While we won't delve into each of these questions today, the short answer is that there is some evidence to suggest that returns are higher from November to April.
Even considering yesterday's widespread equity selloff and the ongoing impact of the global pandemic, many believe the Halloween Indicator could hold true this year.
For those who expect markets to repeat this historically-observed rally and enjoy a strong move up over the next several months, here are two exchange-traded funds in a good position to benefit:
1. SPDR S&P Software & Services ETF
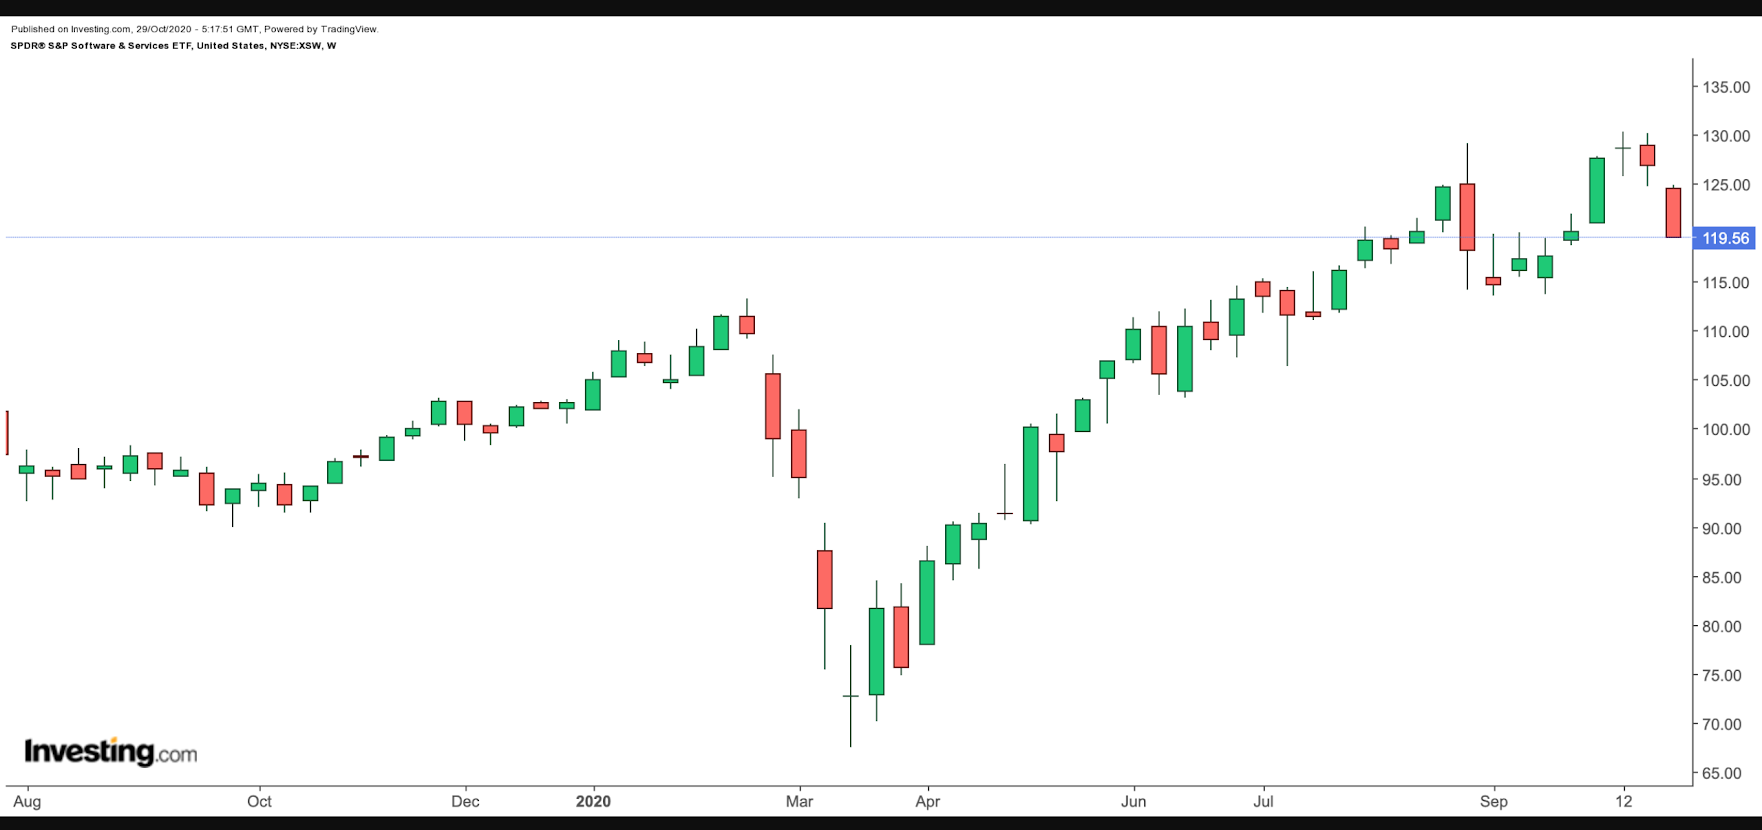
- Current Price: $119.56
- 52-Week Range: $67.56 - $130.35
- Dividend Yield: 0.33%
- Expense Ratio: 0.35%
The SPDR® S&P Software & Services ETF (NYSE:XSW) provides exposure to a wide range of businesses in application software, data processing, interactive home entertainment as well as systems software. The fund first listed in September 2011 and currently has over $268 million under management.

XSW, which has 168 holdings, tracks the S&P® Software & Services Select Industry® Index. No company in the fund has a weighting over 0.9%, which means the short-term effect of an individual stock on the ETF value is not large enough to cause wide swings.
Global content distribution network Cloudflare (NYSE:NET), cloud-based digital advertisement platform Trade Desk (NASDAQ:TTD), human capital management software firm Paycom Software (NYSE:PAYC), payroll and HCM solutions provider Paylocity (NASDAQ:PCTY), and video-conferencing platform Zoom (NASDAQ:ZM) head the list of businesses in the ETF.
Since the start of the year, XSW is up around 19% and hit an all-time high of $130.35 on Oct. 14. Trailing P/E and P/B ratios stand at 27.32 and 5.53.
As many tech names continue to report quarterly earnings in the coming days, volatility with a downward bias may continue in the sector. A short-term fall toward the $115 level is likely. However, the past decade has shown the strength of the tech sector, which has continued to outperform during the pandemic. Therefore, we can expect the sector to make new highs after a possible pause. Long-term investors may consider buying into the declines.
2. Global X E-commerce ETF
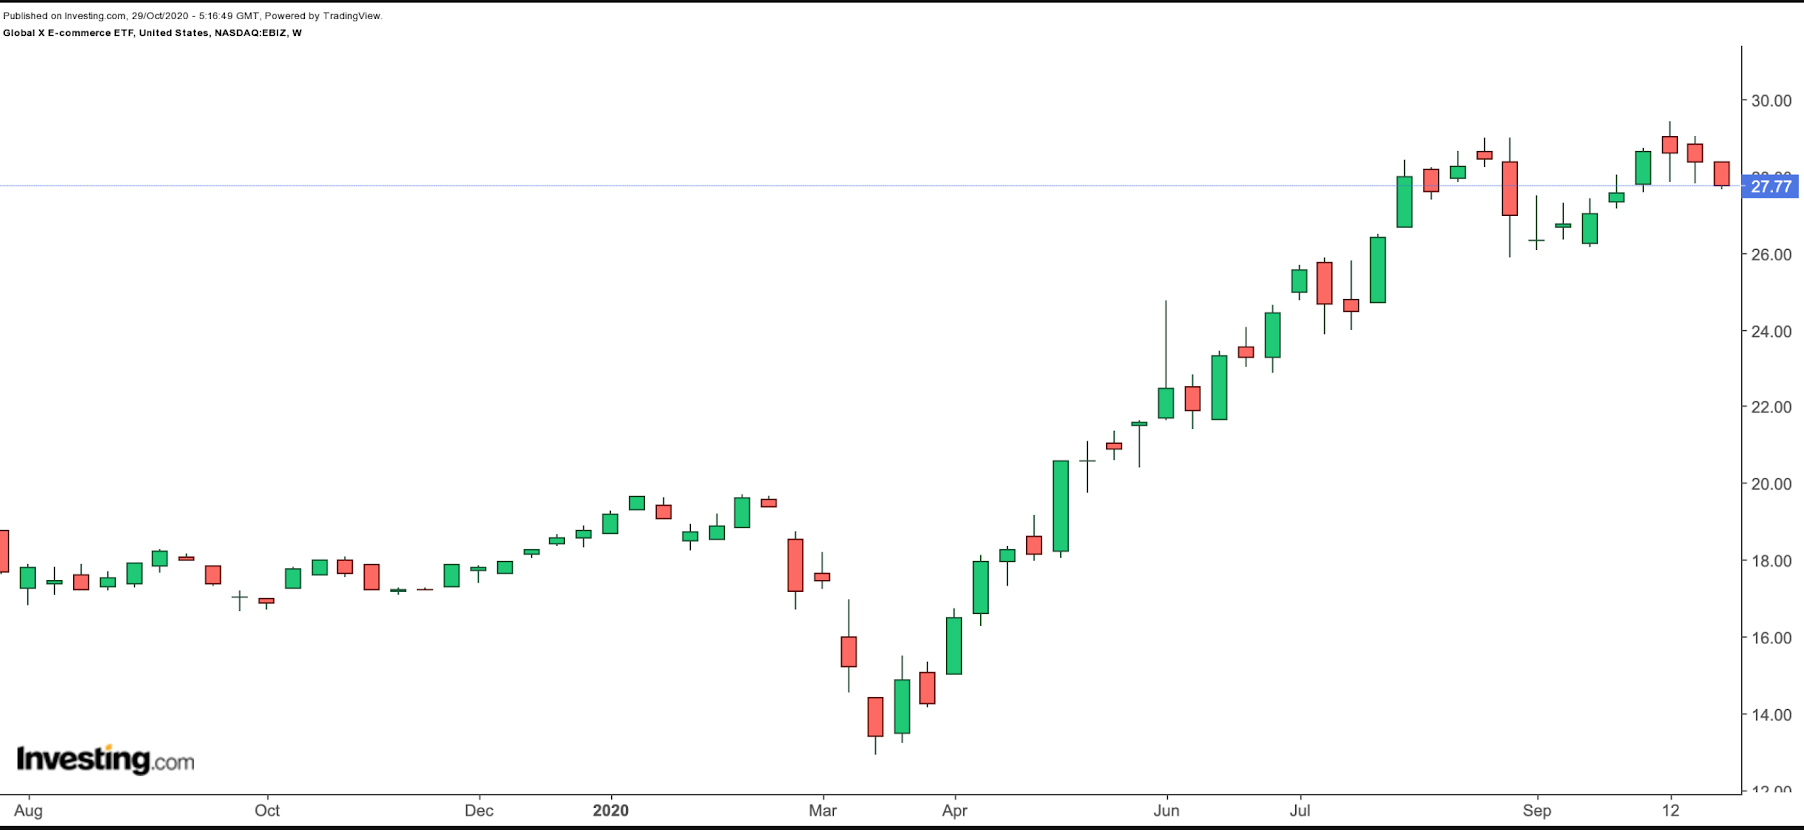
- Current Price: $27.77
- 52-Week Range: $12.94 - $29.44
- Expense Ratio: 0.40%
Many brick and mortar retailers were already under pressure even before the pandemic-induced economic slowdown. The "stay-at-home, work-from-home" trend has made e-commerce one of the winning sectors of 2020. As the second wave of the pandemic continues, billions of people worldwide are expected to continue shopping online.
The Global X E-commerce ETF (NASDAQ:EBIZ) offers access to global firms that operate e-commerce platforms, providing e-commerce software and services, and selling goods and services online.

EBIZ, which has 41 holdings, tracks the Solactive E-commerce Index. The fund has been trading since November 2018 and has close to $95 million under management.
Over half the firms come from the US, followed by China (25.2%), the UK (7.8%), Japan (4.5%), Argentina (4.3%) and Canada (4.1%). Brooklyn, New York-based online marketplace Etsy (NASDAQ:ETSY), e-commerce group JD.com (NASDAQ:JD), online shopping platform Mercadolibre (NASDAQ:MELI), Chinese technology giant Alibaba (NYSE:BABA) and e-commerce group Wayfair (NYSE:W) head the list of companies in the fund.
Year-to-date, EBIZ is up over 19% and hit an all-time high in October. Its trailing P/E ratio of 49.55 and P/B ratio of 4.91 mean it is richly valued. In the coming days, short-term profit-taking may push the ETF toward the $27 level. Such a potential decline would make the risk/return profile more attractive for long-term investors.
The fund may appeal to investors who believe the adoption of e-commerce as a distribution model will increase worldwide.
