Get 40% Off
🤯 This Tech Portfolio is up 29% YTD! Join Now to Get April’s Top PicksGet The Picks – Just 99 USD

Stocks Haven’t Been This Expensive Vs. Bonds In A Decade

Published 29/04/2022, 09:44
Updated 20/09/2023, 11:34

This article was written exclusively for Investing.com

With interest rates surging, stocks have grown more expensive on a relative basis. Over the past 10 years, an excellent way to measure the value of the S&P 500 versus the 10-year Treasury rate has been to use the S&P 500 dividend yield. That valuation range has consistently been able to call tops and bottoms for the markets.

Currently, the difference between the dividend yield and the 10-year Treasury rate is around 1.5%. Said another way, the 10-year rate is now 1.5% higher than the S&P 500 dividend yield. The difference between the two hasn't been this wide since early 2011.

Dividend Yield Vs. Treasury Rate 

Dividend Yield Vs. Treasury Rate

Unless something has changed meaningfully in this relationship, it seems appropriate to believe that the spread is at a point where there isn't much additional room to widen. That would mean either the 10-year Treasury rate needs to decline or the S&P 500 dividend needs to rise. However, in the past, it has generally been the S&P 500 that has fallen in value, an indication of the dividend yield rising.

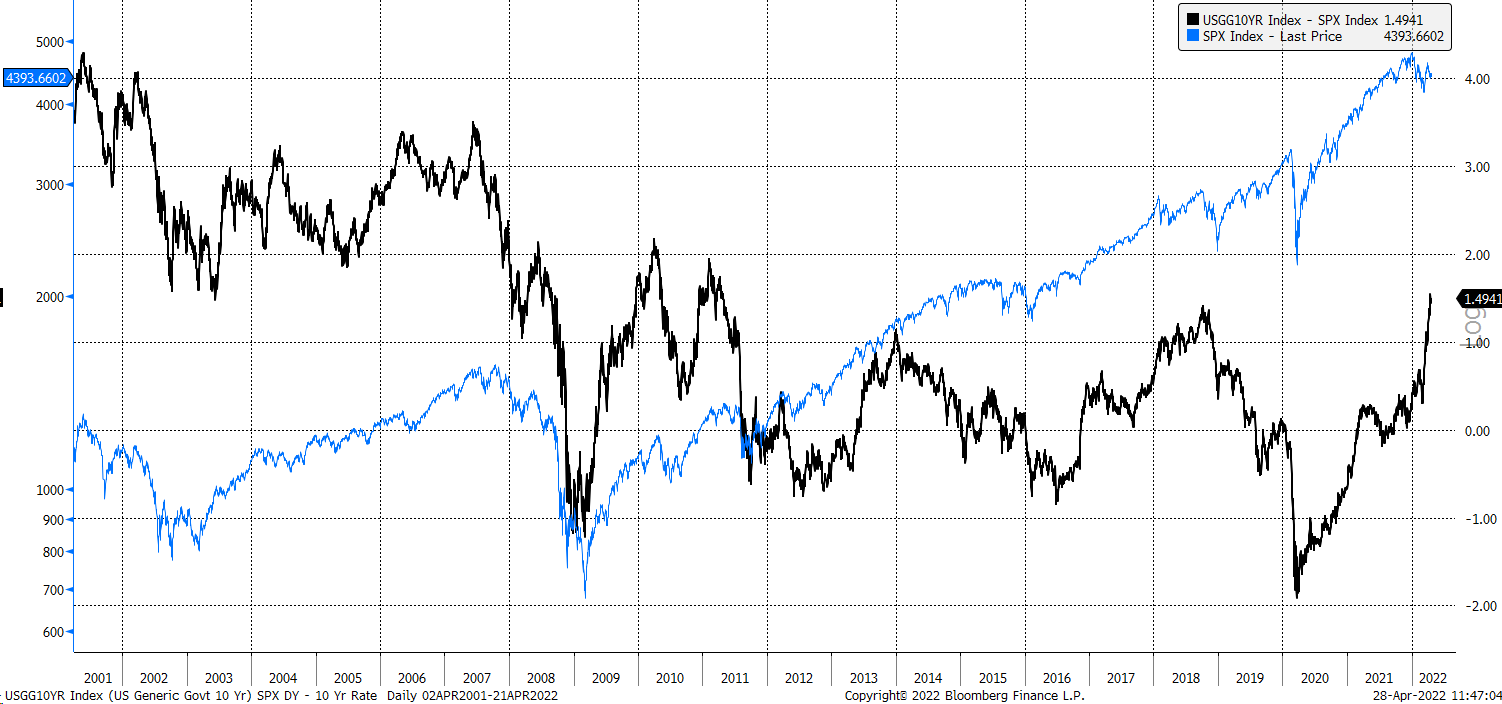
The only time that the S&P 500 didn't see a significant drawdown after the spread widened to 1% or higher came after the 2008 financial crisis was in 2014. Every other period saw big equity drawdowns that ultimately led to the index's dividend yield rising. Such was the case in 2010, 2011, and 2018. It is yet to be seen if the same will happen in 2022, but it would make plenty of sense for that dividend yield to rise and that spread to contract.

Earnings Yield Vs. Treasury Rate

Another option is to use the earnings yield of the S&P 500 versus the 10-year rate, which is at the lowest point in nearly a decade. The spread between the S&P 500 earnings yield and the 10-year rate narrowed to around 1.4% in the middle of April. This would suggest that the earnings yield of the S&P 500 needs to rise, or better, the S&P 500 needs to fall to adjust for the higher interest rate environment.Earnings Vs. Treasury Rate

It is a bit of a moving target to figure how much the S&P 500 should move lower because it depends on how much the 10-year yield rises or falls. But it seems very clear that stocks haven't been this expensive versus rates in a long time, and that stocks are likely very susceptible to weakness, especially if rates continue to rise. The higher rates climb, the more significant the impact will have on stock prices overall and likely act to cap the gains witnessed in equity prices.

Given the push higher in rates, it seems very difficult to imagine stocks returning to their all-time highs soon. They are more likely to feel more pain as rates go higher if the Fed holds to its word of future rate hikes.

Latest comments

where is silver heading
interesting indicator! It agrees with looking at a healthy trajectory for price from pre pandemic to now suggesting more downward pressure. People aren't factoring in that huge growth in tech was part stimulus, part perfect scenario during the pandemic. Remove both those elements and you have to revert to mean average. Add inflation, rate rises and a potential recession and, oh dear just about explains it!
invest in India , Indian Markets have better Scope of Growth
Have you been drinking excessively…my portfolio is down 68%
Risk Disclosure: Trading in financial instruments and/or cryptocurrencies involves high risks including the risk of losing some, or all, of your investment amount, and may not be suitable for all investors. Prices of cryptocurrencies are extremely volatile and may be affected by external factors such as financial, regulatory or political events. Trading on margin increases the financial risks.
Before deciding to trade in financial instrument or cryptocurrencies you should be fully informed of the risks and costs associated with trading the financial markets, carefully consider your investment objectives, level of experience, and risk appetite, and seek professional advice where needed.
Fusion Media would like to remind you that the data contained in this website is not necessarily real-time nor accurate. The data and prices on the website are not necessarily provided by any market or exchange, but may be provided by market makers, and so prices may not be accurate and may differ from the actual price at any given market, meaning prices are indicative and not appropriate for trading purposes. Fusion Media and any provider of the data contained in this website will not accept liability for any loss or damage as a result of your trading, or your reliance on the information contained within this website.
It is prohibited to use, store, reproduce, display, modify, transmit or distribute the data contained in this website without the explicit prior written permission of Fusion Media and/or the data provider. All intellectual property rights are reserved by the providers and/or the exchange providing the data contained in this website.
Fusion Media may be compensated by the advertisers that appear on the website, based on your interaction with the advertisements or advertisers.
© 2007-2024 - Fusion Media Limited. All Rights Reserved.