European stock markets have made a solid start to the second half of the year, making up for yesterday’s losses, whilst Asian shares got the session off to a soft start. Equity indices are looking positive this morning as the FTSE 100 rose 1% and popped above 7,100 again, with the Euro Stoxx 50 and DAX also both +1%, but continue to tread over well-worn ranges.
European and global stock markets have enjoyed a strong run-up in the last six months as a combination of ultra-loose monetary policy, fiscal largesse and a vaccine-enabled reopening of economies allowed investors to look ahead to a brighter future for earnings and growth. Now there are risks on the horizon, but the market remains biased to the upside. That’s been evidenced by fresh record highs on Wall Street as the S&P 500 notched its fifth-straight record closing high. The broad index has risen more than 14% this year, while both the Nasdaq Composite and Dow Jones are up by more than 12%. As bond yields remain subdued, US markets have benefitted from a rotation out of the reflation/reopening trade back into the mega cap growth/tech/growth area of the market, which is propelling the market to new records. The lack of such companies in European indices is perhaps a factor in why they have failed to keep pace.
Data from Asia overnight showed China’s Caixin Manufacturing PMI slipped to 51.3 from 52.0, amid concerns about cases in Guangdong. Meanwhile Japan’s Tankan survey showed a bounce for large manufacturers, with the index up to +14 from +5, its highest level in two and a half years. Services was less positive at +1 from -1.
Eyes on the NFP report tomorrow – still expected at around +700k for June. Yesterday’s ADP report printed 692k vs 600k expected, though the headline beat was offset by revisions to the previous report. Anyway no one cares about ADP (NASDAQ:ADP) – the key labour market tomorrow will be a market mover. Still in the US, pending home sales jumped 8% in May compared with April, the highest level of activity for the month since 2005. Today sees the release of the US ISM manufacturing PMI (exp. 61) and initial jobless claims (exp. +388k).
The focus today is on the oil market as OPEC and its allies convene to decide on production for the month of August and potentially beyond. As we explained in our preview, whilst the market is increasing tight there are one or two concerns about the rise of the Delta variant and what that could do to demand in the second half of the year. OPEC thinks demand should rise 6m bpd in 2021, with 5bpd of that figure due to arrive in H2. This presents a risk as oil demand recovery is weighted to the second half of the year and may not emerge due to new restrictions on mobility in response to new waves of the virus. This could leave OPEC+ cautious about raising output now. Moreover, it does not have the spectre of US oil dominance hanging over it in the same way as it has had in the years preceding the pandemic. US oil production remains about 2m bpd short of pre-pandemic levels and the whole paradigm of US energy has pivoted since the election. The US is not the swing producer anymore and can’t just open the spigots at will, which leaves OPEC holding all the cards.
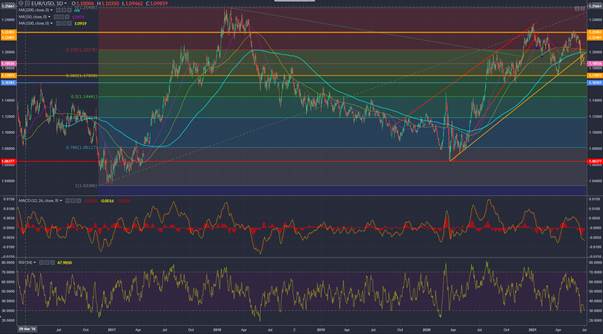
EURUSD bear flag: Solid US data helped lift the dollar, with EURUSD hitting its lowest since April. That bear flag highlighted earlier this week proving reliable and seems to confirm a breakout from the bullish channel of the last year or so. With the new low consider possible extension to the 1.1705 March low, also the 38.2% retracement of the 2016-2018 rally.

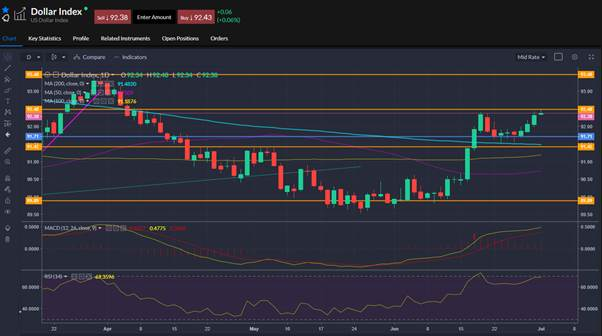
US Dollar Index highest since early April, extending gains after rebounding from the double tap on the 200-day SMA.

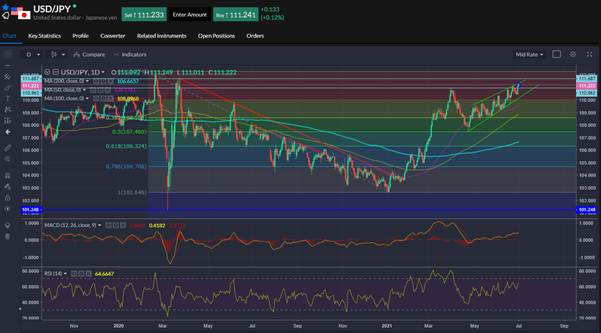
USDJPY: Eyeing breakout from the channel as it keeps above 111 and looks tests the trendline resistance around 111.250. Break of the trendline calls for test of March 2020 highs around 111.70

Which stock should you buy in your very next trade?
With valuations skyrocketing in 2024, many investors are uneasy putting more money into stocks. Unsure where to invest next? Get access to our proven portfolios and discover high-potential opportunities.
In 2024 alone, ProPicks AI identified 2 stocks that surged over 150%, 4 additional stocks that leaped over 30%, and 3 more that climbed over 25%. That's an impressive track record.
With portfolios tailored for Dow stocks, S&P stocks, Tech stocks, and Mid Cap stocks, you can explore various wealth-building strategies.

