When will they ever learn? The MSM financial journalists, I mean. The BoE hiked their interest rate by the expected 0.5% on Thursday. Conventional pundits who believe it is the news that drives the markets were totally flabbergasted by the market’s negative reaction to that news (exacerbated by Friday’s US jobs data). It was the largest hike in several decades and was a noteworthy event, of course.
So what did the market do at 12 noon on Thursday? Of course, it fell quite hard. And because that was totally contra to widespread conventional thinking that 99.999% of financial journalists (and the vast majority of retail traders), all they could come up with was this pathetic headline: “Pound slumps despite biggest interest rate rise in 27 years”.
I have highlighted the weasel word ‘despite’ to point out that whatever words they use in their articles, they still are unaware they have a false view of markets. This repeated litany of failures to explain markets’ movements using the normal ’cause-and -effect’ theory does not deter them at all.
And I believe I know the reason for this. It is that the journalists are writing for a large audience that does cling to the false ’cause-and-effect’ model. Their audience demands such an approach. If they actually wrote about the true nature of financial markets (sentiment driven), they would soon be out of a very lucrative job. As with most life events, just follow the money.
In reality, so many retail traders had bought sterling in anticipation of a good jump in the exchange rate on the news that when they found large selling was entering, they had to exit their trades (to exacerbate the selling!). Sell the News and take the profit on the Dip is the pro’s way!
Jobs, jobs, jobs galore – or is it?
The highly-anticipated monthly BLS non-farms jobs data came in on Friday showing a massive increase in the July jobs numbers (over 500k). The unemployment rate dropped to a multi-decade low of 3.5%
At first sight, this appears to be another case of ‘good news is bad’ – and although that certainly applied to the Treasuries (yields spiked up), share indexes ended the session barely moved.
Conventional analysts would say that is an anomaly – the huge jobs gain implies higher interest rates by the Fed and a stock sell-off (cause and effect). That did not happen, so how can they explain that? They can’t – unless they employ that weasel word ‘despite’!
Very few actually question their beliefs after so many failures.
But looking closer at the data reveals that the increased number of jobs involved double-counting of workers that are holding two full-time jobs. Apparently, low-paid workers today need two jobs to make ends meet in this era of high price inflation – and soaring apartment rents. So the data does not likely signal such a strong US economy after all.
For a while, I have been warning members of my VIP Traders Club to expect a generally rising stock market near term. In last week’s blog I outlined one possibility that stocks could stay elevated for most if not all of this month but that September usually brings about a change of trend (if not sooner).
So far, this scenario is playing out and I maintain my lines in the sand from last week of 4200 in the S&P and 33,300 in the Dow. This is the chart I showed last week:
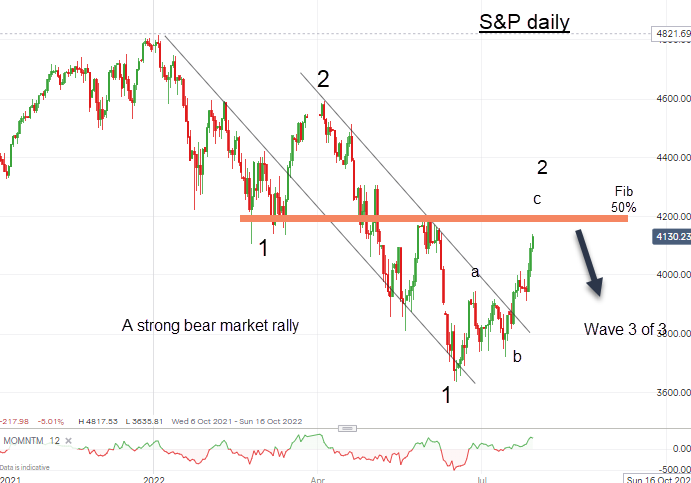
And I note that more and more pundits are saying the bear market is over – and retail traders/investors have been buying tech by the truckload – a very dangerous signal for the bulls.
So who has the outlook right for the economy – the stock guys or the bond vigilantes (T-Bonds fell almost 3 big points yesterday)? Experience tells me that since bond traders are a lot smarter than equity analysts, we can expect interest rates to continue heading north and at some point, equity investors will have to take notice.
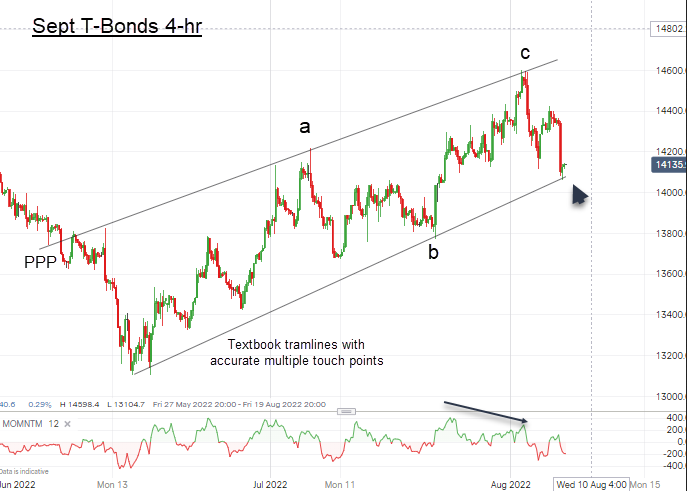
Yesterday the market plunged right to my lower tramline (support) in what looks like a three down so far. Only a sharp break below the tramline would signal a change of trend.
Near-term, all eyes will be on Wednesday’s US CPI print which has the potential to have as much impact (if not more) on the T-Bond chart. The common perception is that ‘inflation is staying high’ with some even saying it is now permanently embedded in the economy. Of course, we all know that there are very few things in finance that are ‘permanent’.
So that is making my contrarian antennae twitch once more. What if the CPI print comes in ‘surprisingly’ lower than expected next week? That would surely send stocks and bonds higher. So maybe that is what the stock market was signalling late on Friday as it rallied off the knee-jerk dip after the jobs report.
And yes, the gambling spirit is not yet dead. A very minor tech stock AMTD Digital (NYSE:HKD) IPO’d and instantly exploded to a 32,000% gain with a valuation of $300 Billion (on a puny turnover of $25 Million). Echoes of GameStop (NYSE:GME)!
And even the mammoth FAANGS have been advancing in recent weeks on the back of good results.
Yes, August is shaping up to be a very eventful month as many traders are away on holiday.
Wheat is moving out of Ukraine now – does this mark the low?
The resumption of Wheat exports out of Ukraine is hitting the MSM headlines. And the timing couldn’t be better for those of us that use the MSM for contrarian signals. The Wheat market has fallen by a whopping 40% as traders prepared for the Ukraine grain being eventually released.
That was always on the cards as Russia, who controlled the release, knew it would gain favour among the less developed nations when they were seen to be feeding their populations again and lowering the food prices. Many Brownie points are being accrued to Russia as shipments resume with no cost to themselves.
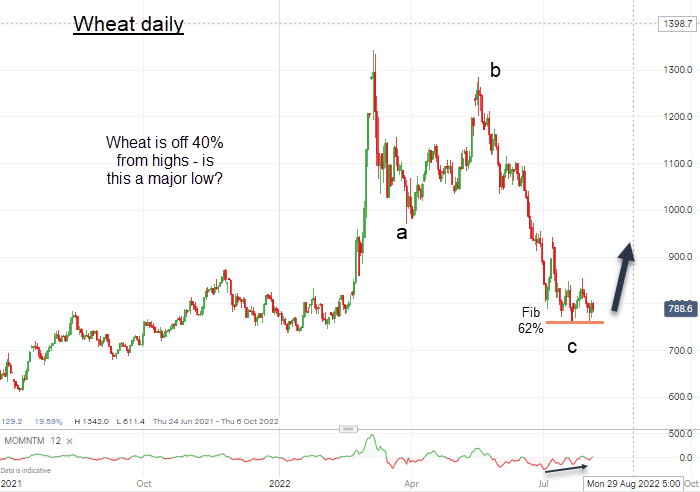
But the market has dropped to the $8 region (from over $13) which is a Fib 62% retrace on a strong mom div – and into a major long-term support zone.
So with the ‘bad’ news out of the way, the path is clear for poor weather to impact the market again – and send prices shooting back up.
Crude oil dips – are we at a low?
Take a look at the daily US Crude chart – do you see anything familiar?
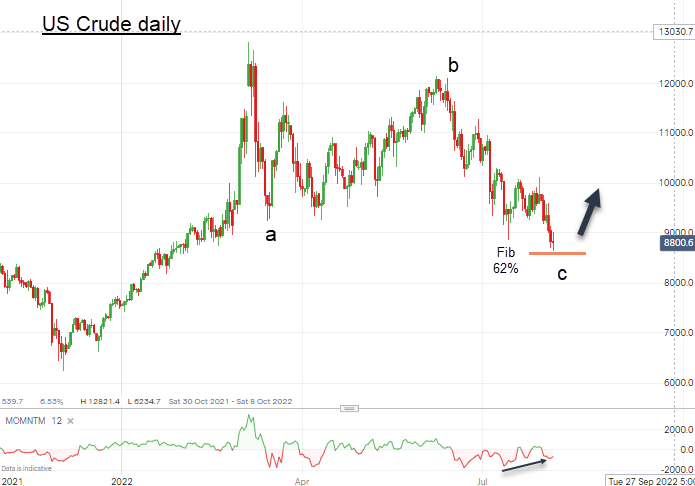
Yes, it is almost identical to the Wheat chart above! It has now dipped to the Fib 62% on a three down to a strong mom div just like in Wheat. Not only that, but both peaks occurred on the very same day on 8 March.
How can that be – surely these two commodities are unrelated? Of course they are unrelated in the sense that even if Wheat stocks fell (prices rise), the oil supply/demand balance would not change a jot.
So what is going on? Of course, you have probably figured it out – markets are not driven by the usual ’cause-and-effect’ model that economists use. Both markets were in highly emotional states earlier this year and were driven by the same bullish fervour that drove many other markets higher at the time.
With such a high correlation between Crude and Wheat, I expect both to resume major bull runs now.
Gold heads north
The advance in Gold continues off the 21 July low at $1681.
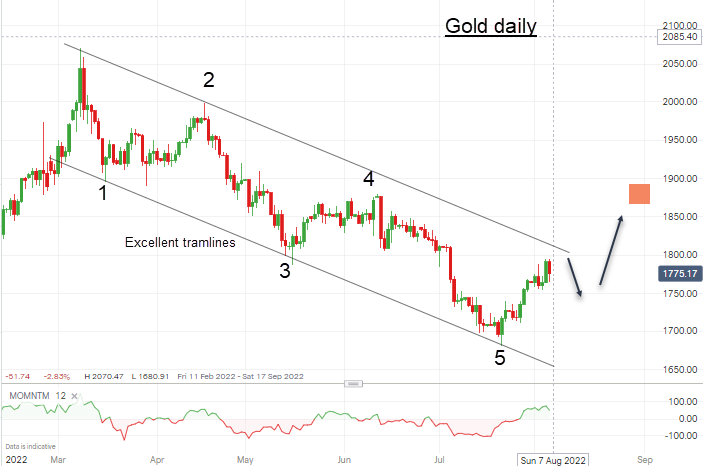
Gold is the ultimate ‘sentiment’ market. Considerations of supply and demand for the physical metal play little or no part in how the price moves. Thus, fundamentals are not useful in forecasting price. What is useful is analysing the technical picture – and my Tramline methods are especially useful here.
I have excellent tramlines off the March high and the market is working up to the upper line where I expect at least a pause. But my major target around the $1875 region (the Fib 50% retrace) still holds.
