- Weak economic data has sparked concerns that the economy may be slowing faster than expected.
- Indexes reversed early gains as soon as manufacturing data came out.
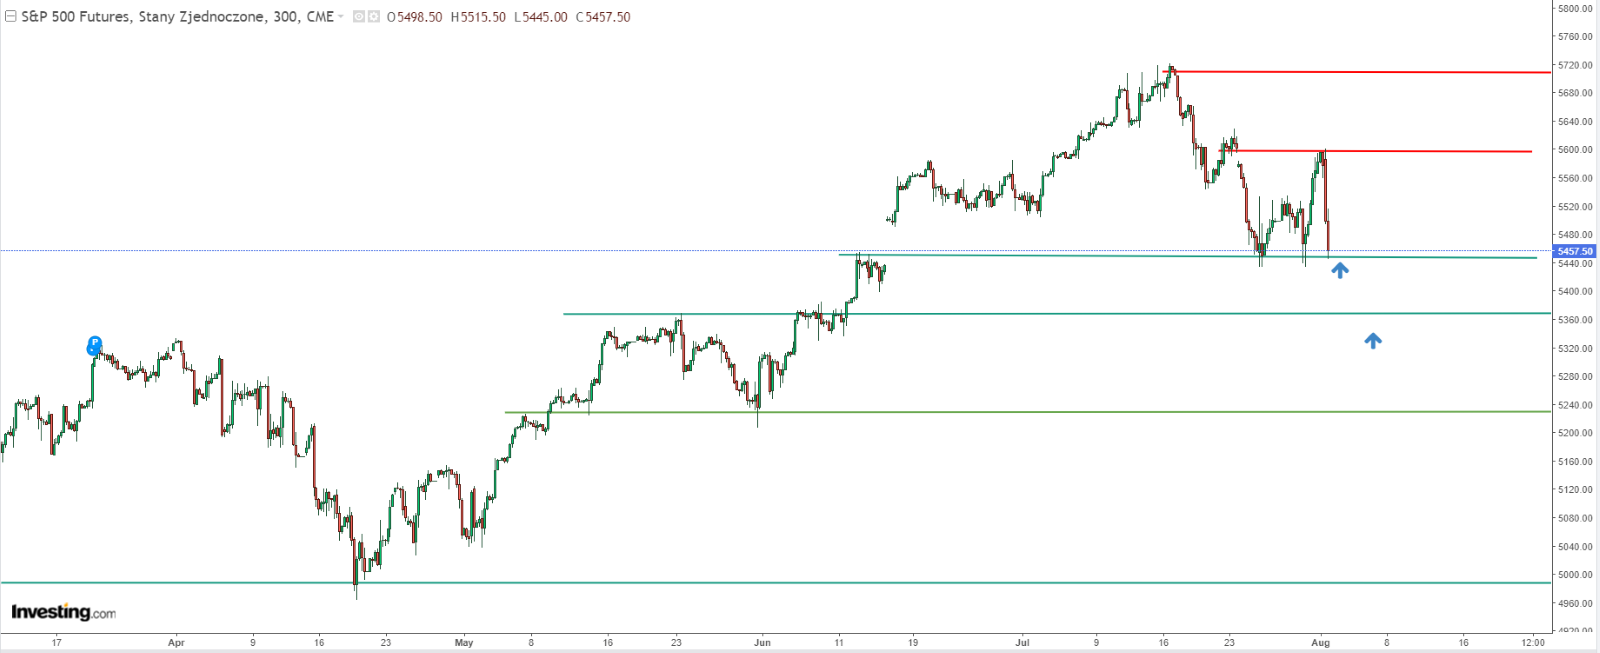
- Technically, the S&P 500 has tested a key support several times and could break below it today.
- Unlock AI-powered Stock Picks for Under $8/Month: Summer Sale Starts Now!
The Federal Reserve's dovish tilt initially boosted market sentiment early on in the week. However, the subsequent release of weaker-than-expected US industrial data has dampened investor enthusiasm sparking concerns that the economy may be slowing faster than expected.

The S&P 500 and other major indexes experienced a pullback as traders reassessed the likelihood of a September rate cut. The market's focus now shifts to upcoming economic data releases for further clarity on the Fed's policy trajectory.
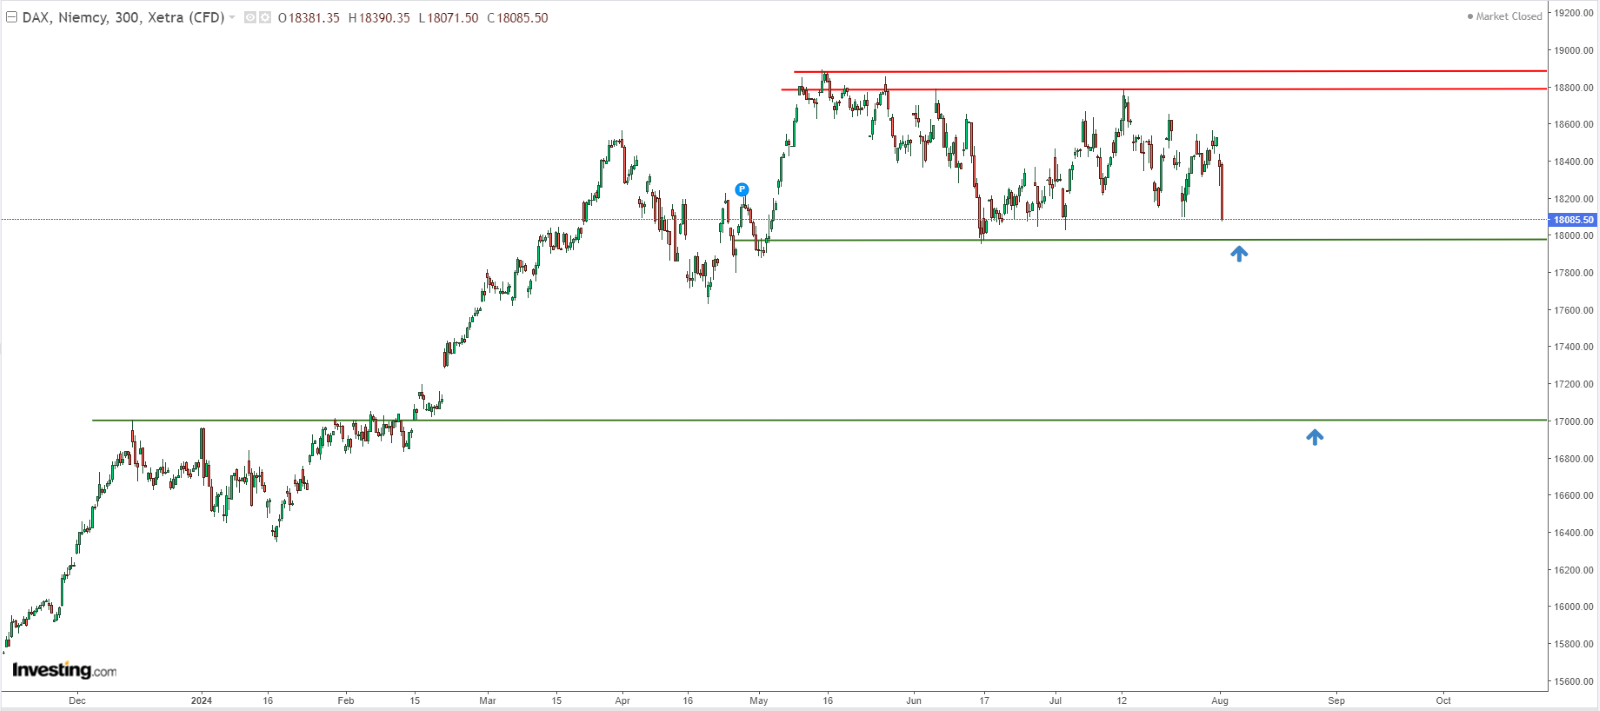
In Europe, the German index DAX is showing signs of weakness, with the potential for a deeper correction emerging. The index has been consolidating in a range, and a breakdown below key support levels could accelerate the downward move.
S&P 500 Targets Key Support
The S&P 500 has experienced a small rollercoaster recently due to mixed signals and macroeconomic data. Currently, sellers dominate the market, with the index repeatedly testing support around 5,440 points.
Given the strong downward impulse, the likely scenario is a break below this support, targeting the next barrier below 5,400 points. If the decline continues, the next target would be around 5,200 points.

In the bullish scenario, A break above the newly formed resistance at 5,600 points would negate this bearish outlook and could lead to an attempt to reach recent highs.
DAX: Bears Set to Attempt Another Move Lower
Since early May, the DAX has been trading sideways, with the upper limit at the historical high of 18,900 points.
Despite one unsuccessful attempt by the bulls to break through, sellers are now aiming to capitalize on this failure. Investors should focus on the lower band of the consolidation at 18,000 points.

A break below this support would signal a clear bearish trend, potentially driving the index down to 17,000 points.
This scenario assumes sustained negative sentiment towards the global stock market, which could be exacerbated by events like escalating tensions in the Middle East.
***
This summer, get exclusive discounts on our subscriptions, including annual plans for less than $8 a month!
Tired of watching the big players rake in profits while you're left on the sidelines?
InvestingPro's revolutionary AI tool, ProPicks, puts the power of Wall Street's secret weapon - AI-powered stock selection - at YOUR fingertips!
Don't miss this limited-time offer.
Subscribe to InvestingPro today and take your investing game to the next level!
Disclaimer: This article is written for informational purposes only; it does not constitute a solicitation, offer, advice, counsel or recommendation to invest as such it is not intended to incentivize the purchase of assets in any way. I would like to remind you that any type of asset, is evaluated from multiple perspectives and is highly risky and therefore, any investment decision and the associated risk remains with the investor.

