This article was written exclusively for Investing.com
- Dollar Index bear market isn't bearish for commodity prices
- Stimulus and liquidity are bullish catalysts for raw materials going forward
- A risk-off period is an opportunity to add commodity exposure to portfolios
- 2008 through 2012 could be model for the coming years, but markets rarely move in a straight line
The most recent meeting of the US Federal Reserve’s Federal Open Market Committee (FOMC), in mid-September, formalized a shift in central bank policy. The FOMC establishes short-term interest rates.
The Fed Funds Rate is a tool that allows the central bank to react to changes in the economic landscape. The committee made no changes in the short-term rate as it remained at the zero to twenty-five basis point level, the lowest in history.
The Fed followed through on Chairman Powell’s comment from the Jackson Hole virtual conference in August. He told markets that the central bank will no longer consider a 2% target rate for inflation a line in the sand but would look for an average of 2% over time. The policy change will allow inflationary pressures to rise above the target rate for a “period.” Some committee members suggested that inflation could increase to 2.25% or even 2.50% before the Fed uses interest rate policy.
The central bank lowered short-term rates to zero percent earlier this year, fired bazookas of liquidity into the financial system, and employed quantitative easing to push rates lower further out along the yield curve. These policies, to encourage borrowing and spending and inhibit saving, are a reaction to the weak economy caused by the pandemic. The latest move to allow and even promote inflation to rise amounts to more bullish fuel for the commodities asset class.
Dollar Index bear market isn't bearish for commodity prices
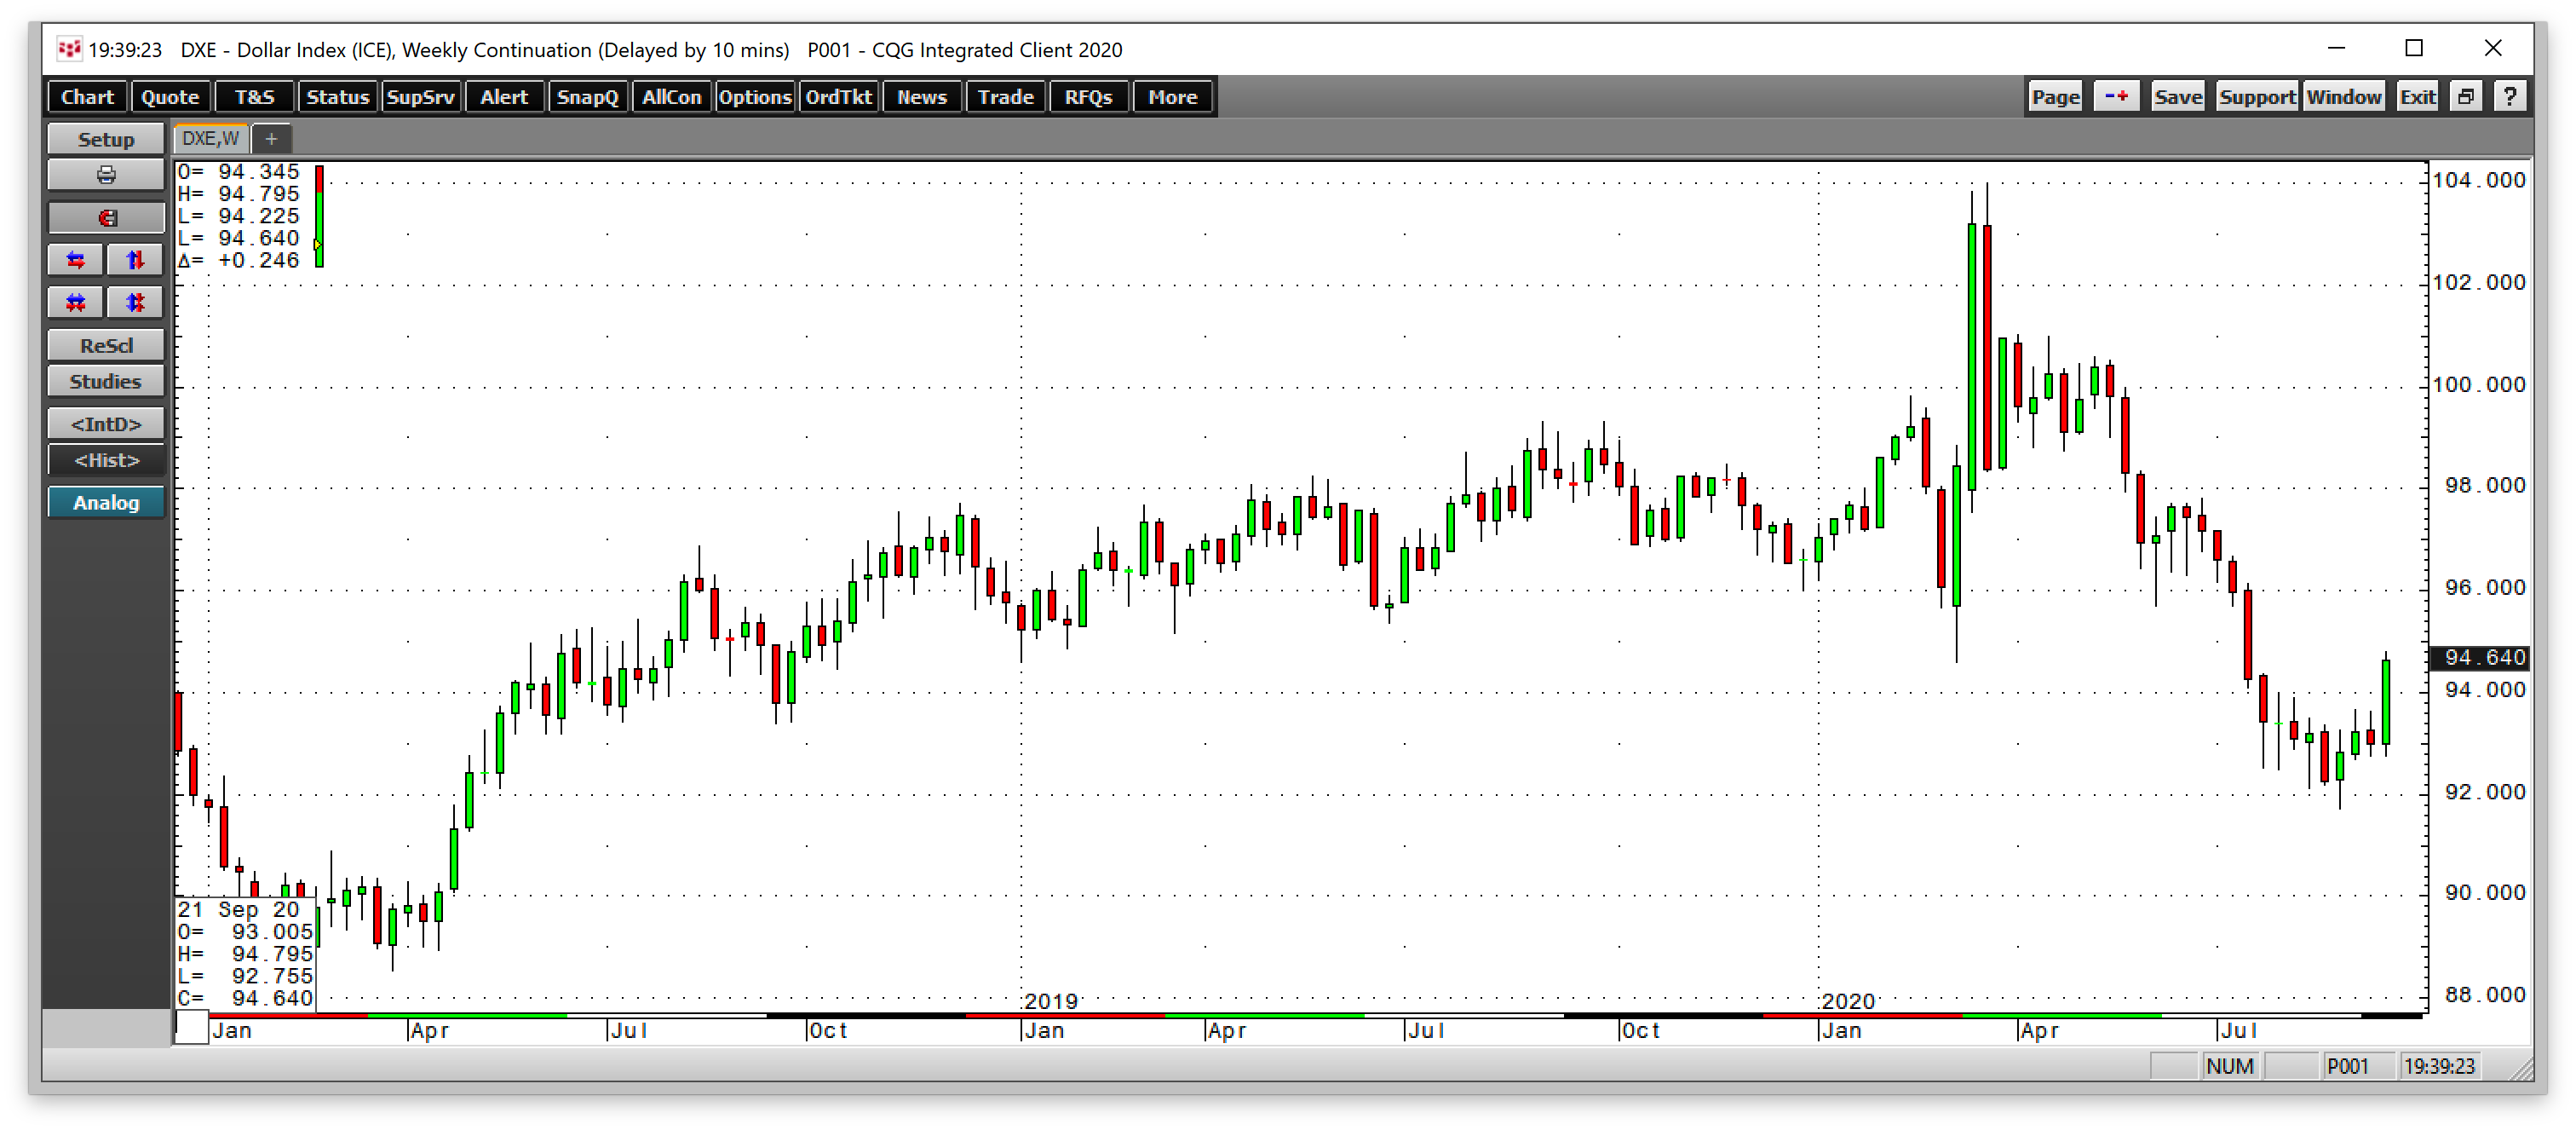
The Dollar Index bounced over the past week and was trading at the 94.682 level on Friday, September 25. 
Source, all charts: CQG
As the weekly chart of the Dollar Index highlights, the US currency was trading at 94.640 after the recent recovery. The range in 2020 has been from a high of 103.96 in March to 91.925 on Sept. 1. At just over 94.60, at the end of last week, the dollar index was closer to the low than the high for this year.
The high was the highest level for the index that measures the value of the dollar against other world currencies since 2002. A flight to quality during the risk-off period in markets lifted the dollar, but it turned lower and fell steadily until early September. Currencies rarely exhibit significant price volatility as governments manage price variance to stabilize the global financial system. Even though the index bounced from its most recent low, the trend for the USD remains lower, and only a move above the 98 level would reverse the current path of the greenback.
Since the dollar is the world’s reserve currency, it's also the pricing benchmark for virtually all commodities. A weakening dollar typically supports higher raw material prices. The recent rise caused most commodities to move lower.
Stimulus and liquidity are bullish catalysts for raw materials going forward
The global pandemic caused the US central bank and its counterparts worldwide to slash short-term interest rates and inject unprecedented levels of liquidity into the global financial system. Following the example from the 2008 financial crisis, the central banks have used monetary policy to encourage borrowing and spending and inhibit savings to stimulate the economy.
Simultaneously, quantitative easing programs pushed rates lower and further out along the yield curve. The Federal Reserve told markets they would continue to use all of the tools at its disposal during the crisis and its aftermath. The Fed Funds rate is at zero percent, and the central bank installed a put under the bond market when it comes to asset purchases.
In August, Fed Chairman Jerome Powell told markets the 2% target rate for inflation will now be an average rather than a line in the sand. At the September FOMC meeting, the Fed formalized the policy, which will encourage rising inflation. Meanwhile, government fiscal stimulus programs and central bank monetary policy increase the supply of money in the financial system. The bottom line is that the response to the coronavirus and economic contraction and the Fed’s toleration of higher inflation is bullish for commodity prices for the coming months and years.
A risk-off period is an opportunity to add commodity exposure to portfolios
The fall tends to be a historically weak period for the stock market. Indeed, almost on cue, the leading indices began to experience selling pressure after reaching all-time highs in September.

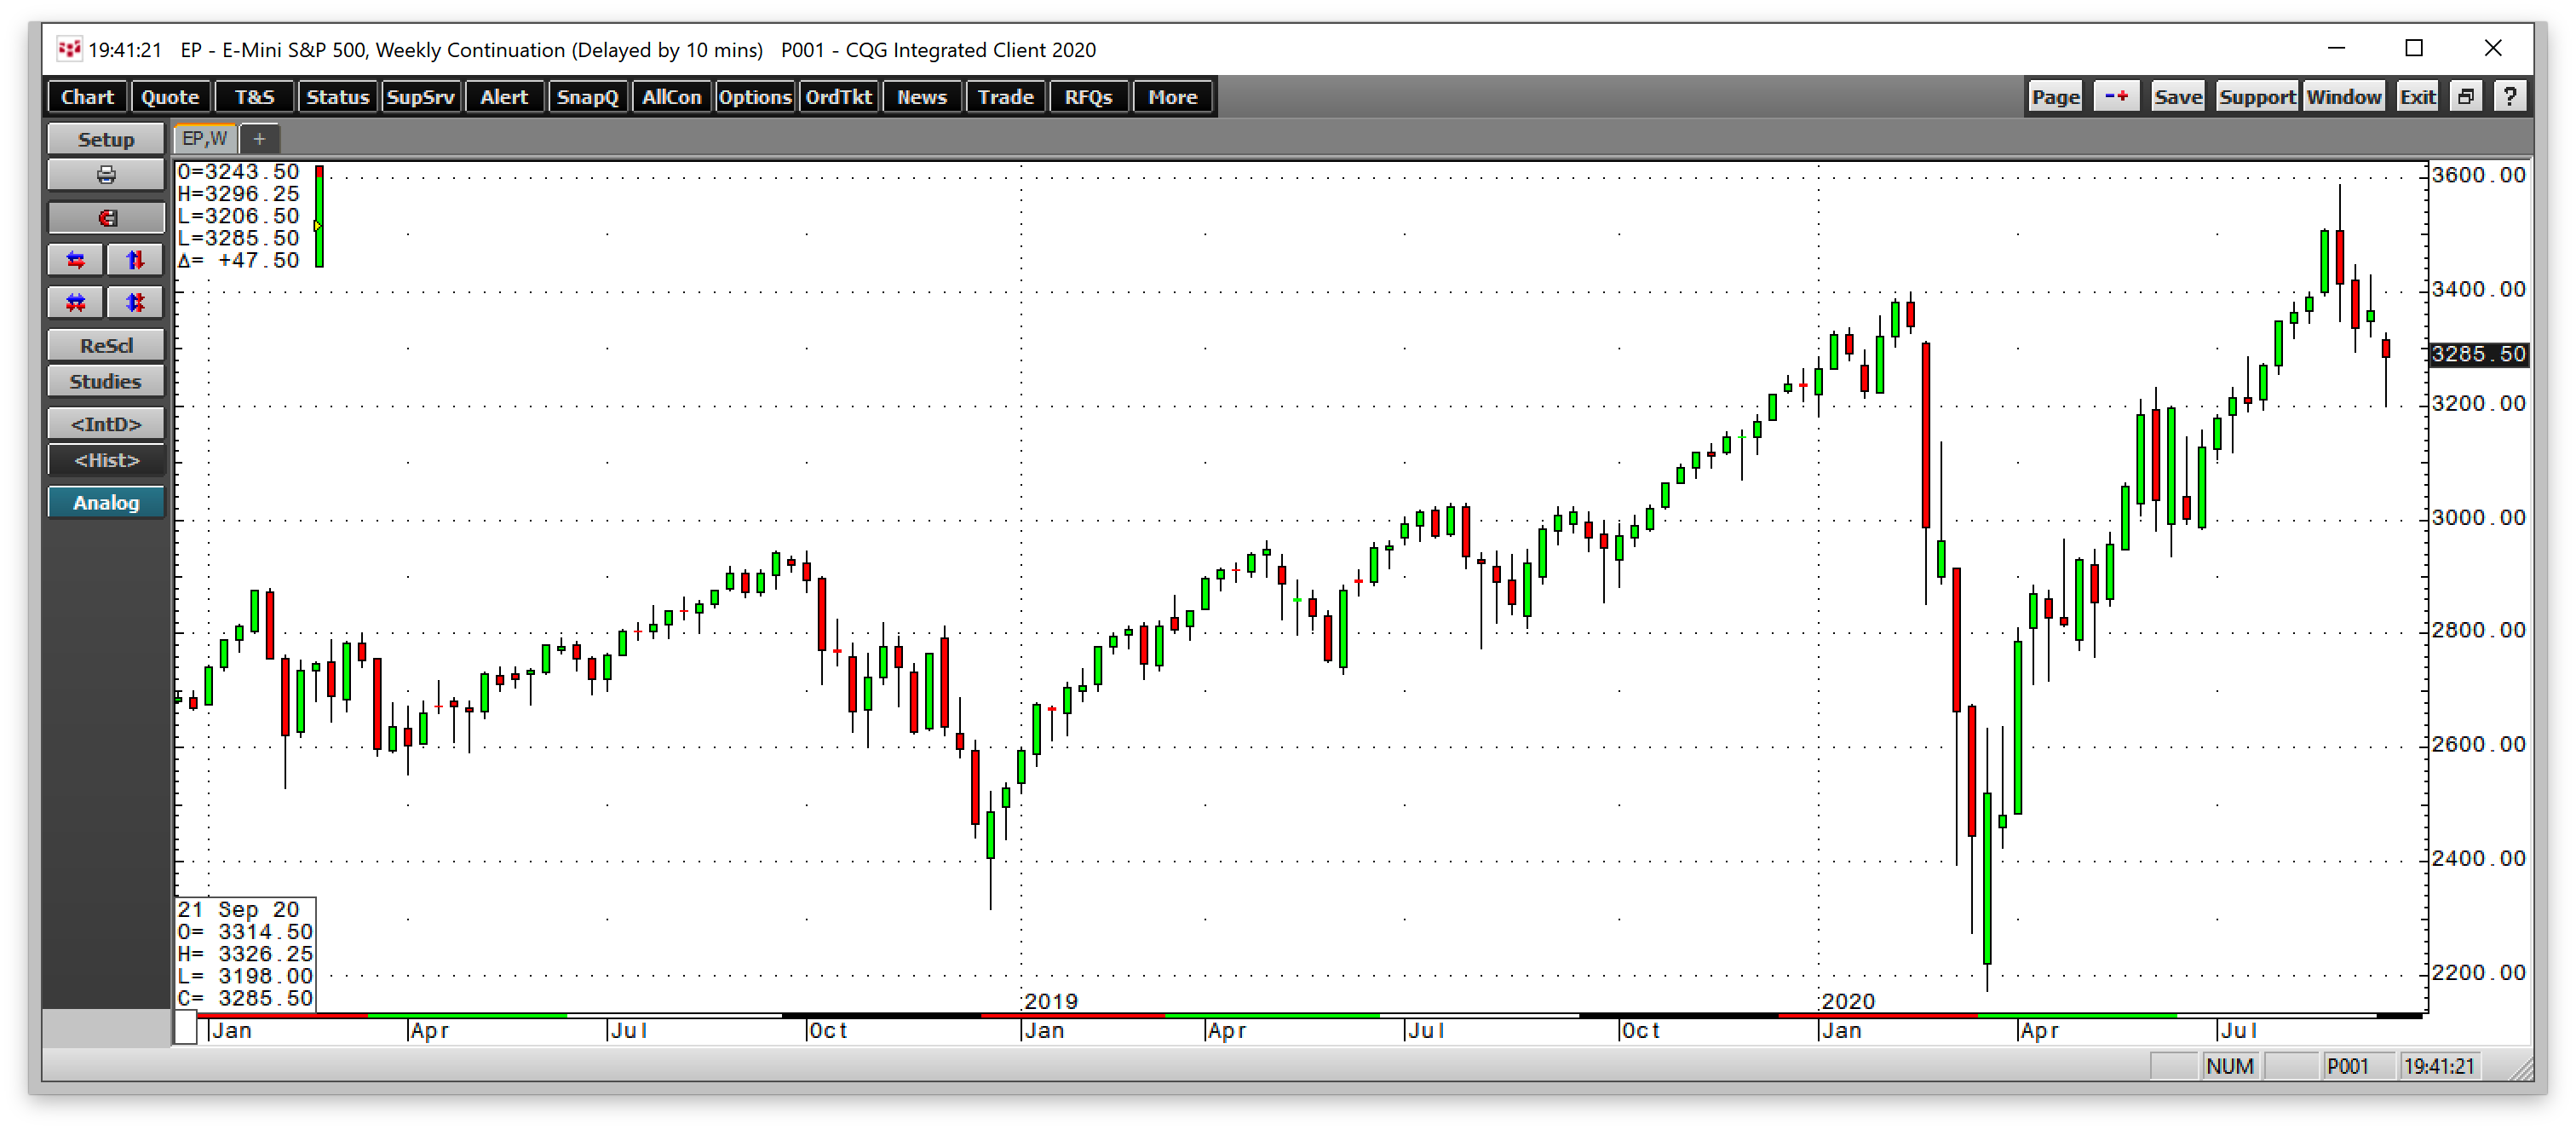
As the weekly chart of the E-Mini S&P 500 Futures contract illustrates, the stock market hit a speed bump after reaching an all-time peak during the first week of September. The memories of the price action in February and March are causing selling in markets across all asset classes. Gold and silver prices have experienced significant corrections. copper, which rose to over $3.10 per pound for the first time since June 2018, was just below the $3 level at the end of last week. Crude oil corrected from the August high, and many other commodities have experienced selling pressure. The bounce in the dollar, which is likely another round of safe-haven buying, added to the bearish price action in the raw materials sector.
Meanwhile, markets rarely move in a straight line. Even the most aggressive bull markets experience corrective periods. Given the current economic landscape, the selling in the commodities asset class is likely to be another buying opportunity on the road to far higher prices over the coming years. A risk-off period would only prompt more stimulus from governments and central banks.
2008 through 2012 could be model for the coming years, but markets rarely move in a straight line
While each crisis is different, the tools to treat the impact often have similar results. In 2008, following the US housing crisis and European sovereign debt debacle caused central banks and governments to employ unprecedented levels of liquidity and stimulus to support the global financial system. From June through September 2008, the US Treasury borrowed a record $530 billion to fund the stimulus. In May 2020, they borrowed $3 trillion.
The US government is unlikely to agree on anything in the current political environment as the November 3 election approaches. The contest will determine if President Trump will win a second term or if former vice president Joe Biden will replace him in the Oval Office. The election will also decide the majorities in the House of Representatives and the Senate. The recent passing of Supreme Court Justice Ruth Bader Ginsburg and the President’s plan to nominate her replacement last weekend has only inflamed passions on both sides of the political aisle in Washington DC. While the chances of another stimulus package over the coming weeks have declined, the government’s need to act will force more stimulus in the aftermath of the election. The bottom line is that the US Treasury will be borrowing more in the coming weeks and months.
Central bank and government policies that increase the money supply and the Fed’s toleration of rising inflation are policies that weigh on the purchasing power of money. The environment is extremely bullish for the commodities asset class. From 2008 through 2012, raw material prices moved from the risk-off period into a bull market that took most prices to multi-year highs and others to record levels.
Almost all sectors of the commodities market rallied over the four years. In 2011, gold and copper reached record highs. Crude oil moved back over $100 per barrel. Many agricultural commodities rose to multi-year highs in 2011 and 2012, with corn and soybean prices reaching record levels in 2012 after a drought added to the bullish landscape for prices.
The bottom line is that the cause of the turbulence in the economic landscape in 2020 is different from in 2008. However, the treatment and policies are the same, and the levels of liquidity and stimulus are far higher. Albert Einstein once said:
“Insanity is doing the same thing over and over and expecting different results.”
Given the policies of governments and monetary authorities, Einstein would be very bullish on commodity prices for the coming years. Buying the dip in the raw materials sector could be the optimal approach during the current risk-off period.
The September FOMC meeting poured more bullish fuel over a smoldering fire in the commodities markets. The current correction creates an opportunity.
