Market Overview
The dust is still settling on another period of tumult for traders to get their heads around. Friday’s latest escalation in trade tensions from Trump brought broad increases across the tariffs spectrum. However, this was to be followed by yesterday’s far more conciliatory tone of prospective talks with China after a constructive telephone call. Markets swinging first one way (sharply risk negative: yen and gold strength, dollar under pressure, equities lower) only to unwind the moves yesterday. However, China seems to be far more reticent over the prospect of talks, with several officials even denying that a phone call took place. All this noise creates volatility for markets, but changes very little. The prospect of a resolution in this trade dispute has not even had the roadmap drawn yet, let alone begun the journey. As such the safe haven bias of yen strength, gold strength should remain favourable (taking in mind some bumps along the way). A degree of risk aversion is already back in the market this morning (yen outperforming, Aussie and Kiwi under pressure, S&P 500 futures lower), suggesting that traders are once more waking up to reality with regards to the US/China trade dispute.
Wall Street closed with the S&P 500 +1.1% higher at 2878, however, US futures are giving back -0.2% this morning. There has been a decent bounce on Asian markets with the Nikkei +1.0% and Shanghai Composite +1.3%. European markets are mixed at the open with the DAX futures +0.1% but FTSE futures -0.5%. In forex, the main mover is JPY resuming outperformance across the majors, whilst AUD and NZD are pressured once more. In commodities, gold is once more regaining ground almost half a percent higher, whilst oil is relatively supported in early moves.
It is a US centric focus for the economic calendar today with consumer confidence key. The S&P Case-Shiller House Price Index is at 1400BST and is expected to remain at +2.4% in June (+2.4% in May). The Conference Board’s Consumer Confidence is at 1500BST and is expected to show a deterioration back to 129.5 in August (down from 135.7 in July) although this would still be strong. The Richmond Fed’s Composite index at 1500BST is expected to improve back into positive at +3 in August (from -12 in July).
Chart of the Day – EUR/JPY
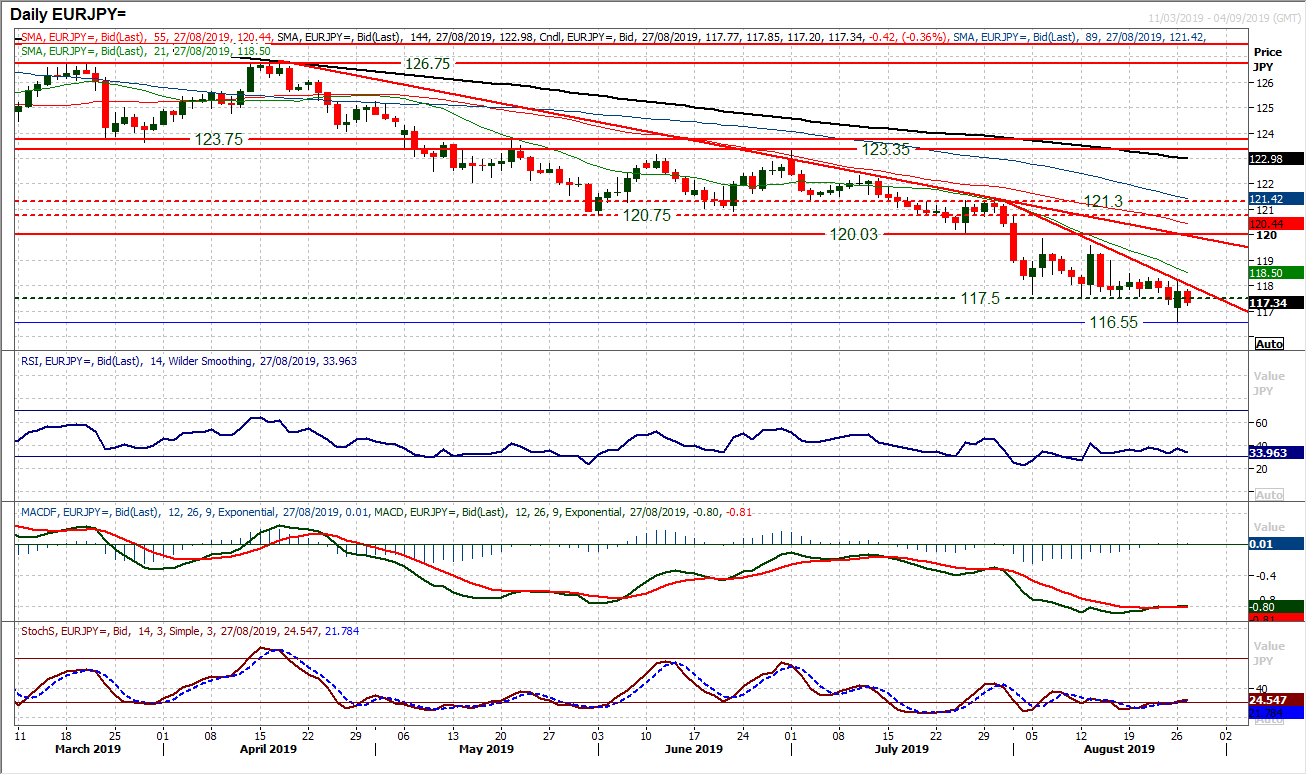
We continue to see strong yen outperformance across the major currency crosses. This is certainly the case on Euro/Yen where for months there has been a consistent run of lower highs and lower lows. For almost three weeks EUR/JPY has been testing support at 117.50 but this support has finally given way to open lows not seen since April 2017. This should now continue the move down towards the critical low at 114.80. Rallies remain a chance to sell. Friday’s close below 117.50 completed the breakdown, whilst yesterday’s positive session simply gives another selling opportunity. Last week’s high around 118.50 is the key near term resistance meaning that between 117.50/118.50 is now a sell zone. The falling 21 day moving average (currently at 118.55) has also been a basis of resistance for eight weeks now. The sellers are already looking to reassert themselves again today as the market moves ever lower. Yesterday’s low at 116.55 is initial support but expect this to be retested before moving lower towards 114.80 in due course.
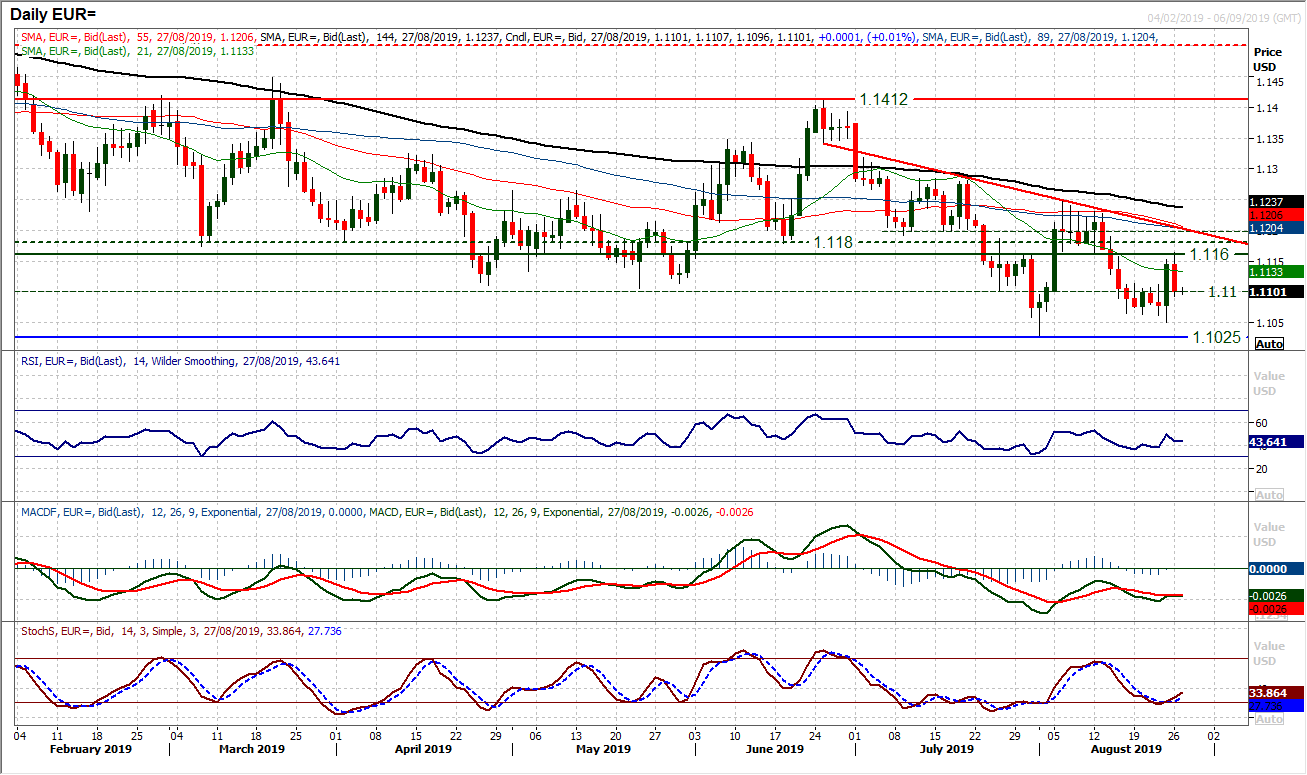
It looked as though Friday’s positive candle (a bullish engulfing candlestick) would be ready to reassert some euro bull control. However, the recovery momentum was quickly snuffed out as the market retreated back to $1.1100 once more. There is a floor of old support between $1.1100/$1.1110 which has just become a form of pivot in the last week or so and it is interesting that the market has once more settled around here. We see EUR/USD as a pair that will struggle for sustained direction in the coming weeks, however there is a broad negative drift that continues to suggest selling into strength. The overhead supply is growing around a pivot at $1.1160 (shown well on the hourly chart) up to $1.1200. The resistance of a two month downtrend also comes in around $1.1200 today. Momentum remains negatively configured on a medium term basis and suggests that rallies will fade. However, support is in place at $1.1025/$1.1050 and the sellers never really get sustained momentum going.
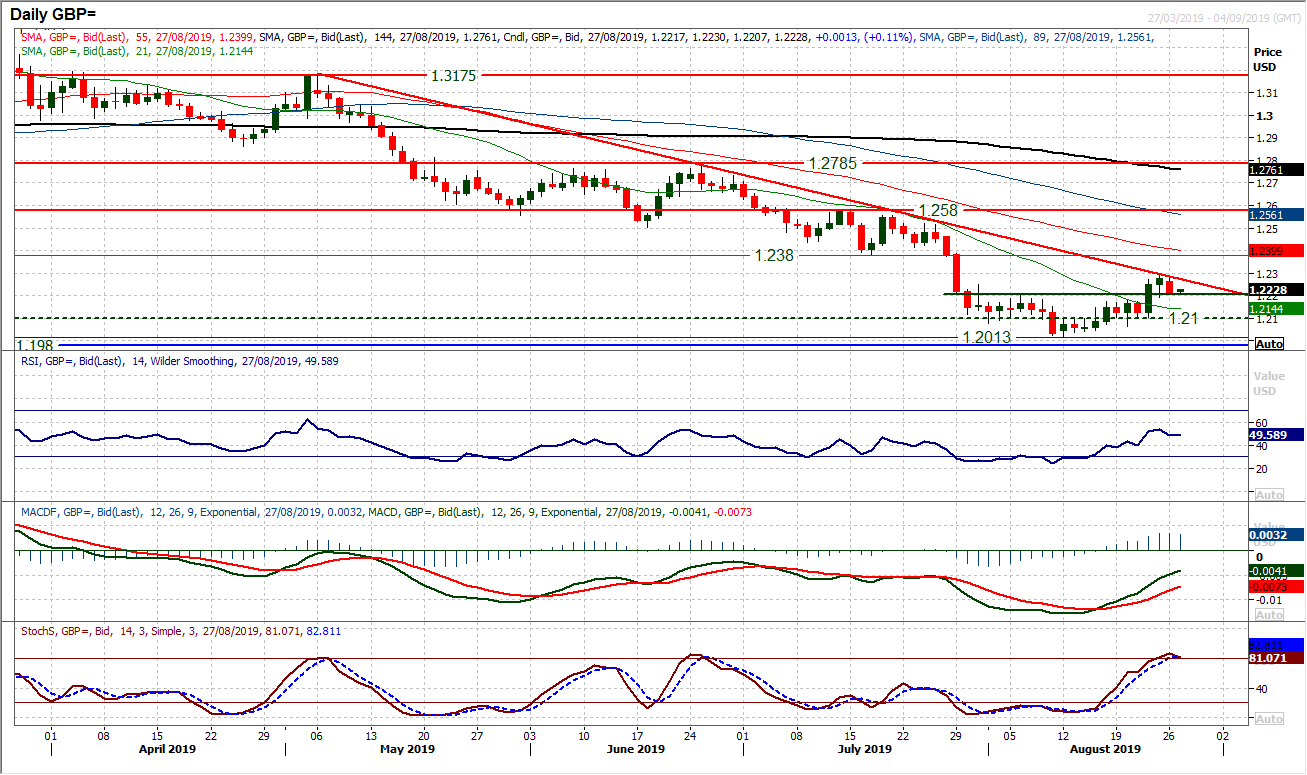
Cable technicals have been gradually improving over the past couple of weeks. The breakout above $1.2200/$1.2250 resistance was the first really positive move for the sterling bulls for weeks, however, the bulls are stuttering again. A failure at a 16 week downtrend with a negative candle has pulled the market back into the support around $1.2200. How the market responds at this support will be key for the prospects of a near term recovery. We remain sellers into strength but if the market can hold around $1.2200 and begin to build positive candles again, then the bulls can use this as a springboard for a rebound towards the $1.2380 old key low again (the next real resistance above Friday’s high of $1.2295). However, daily momentum is already rolling over around medium term sell signal areas. The RSI is failing around 50 and Stochastics are falling over. Another bear candle today with a close below $1.2200 would be a negative signal and re-open pressure on $1.2100 again.
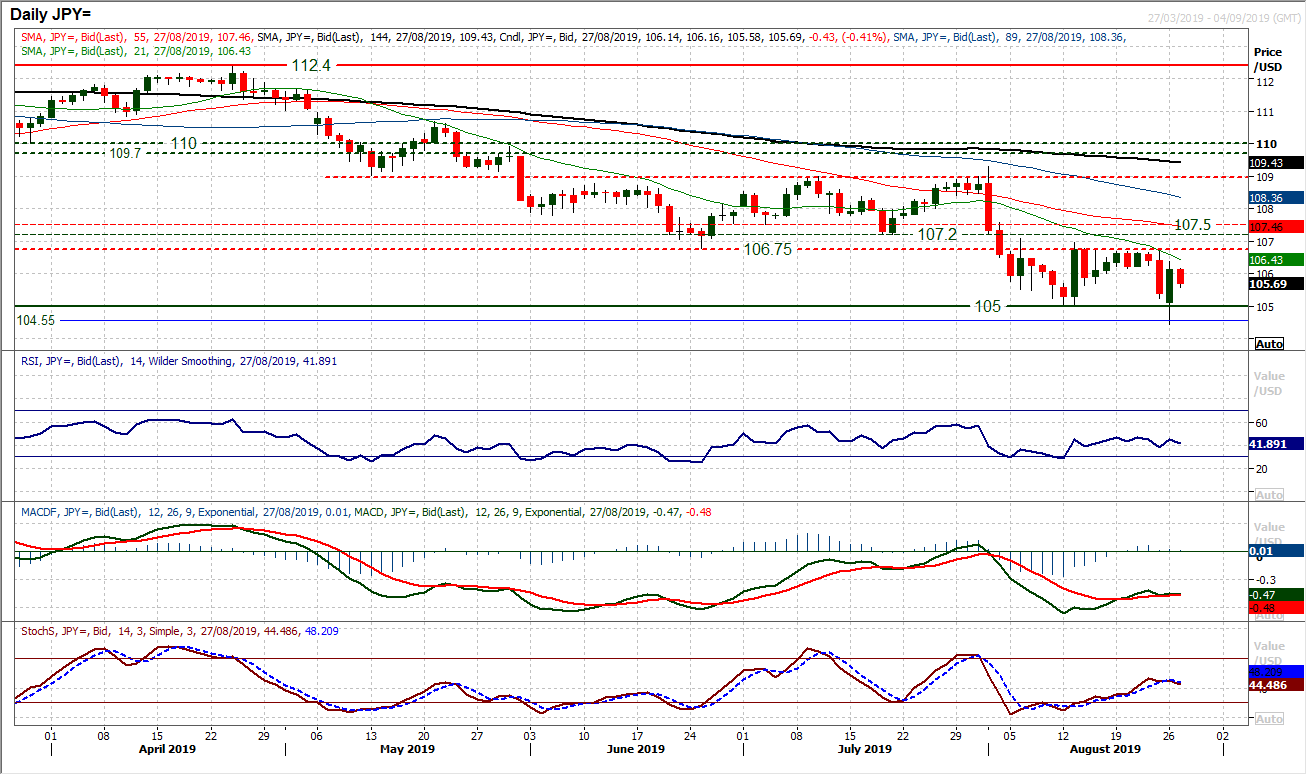
The market retains high levels of intraday volatility. The last couple of sessions reflect this, with a couple of huge bear and bull candles. Stepping back though, we continue to see further yen outperformance. With the overhead supply between 106.75/107.50 proving to be too much, the resistance formed last week. This remains a key barrier and rallies should be seen as a chance to sell. So when the market responded to Friday’s sharp bear candle with a strong rebound, the move looks to be a selling opportunity. Momentum indicators remain negatively configured on a medium term basis, with the RSI stuck below 50 and MACD lines struggling below neutral. Yesterday’s intraday breach of 105.00 hit a low at 104.45 but this is likely to be retested in due course. The hourly chart shows a resistance band 106.20/106.75 is a sell zone now. Yesterday’s rebound high at 106.40 adds to resistance as the sellers seem to be reasserting today.
Gold
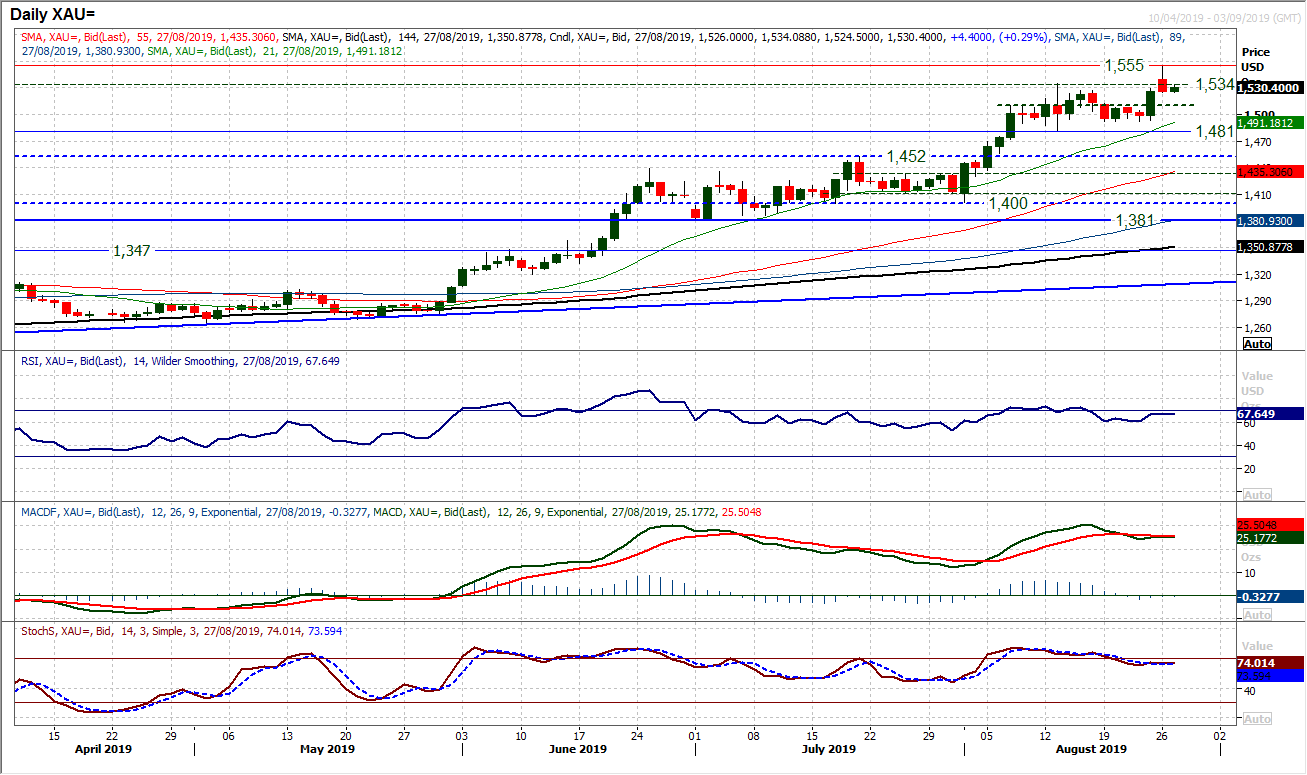
The breakout to multi-year highs has just had the reins pulled slightly as yesterday’s bull move unwound to show the market flat into the close. Although breaking the consolidation range above $1534 could not be held on a closing basis, the bulls will still be enthused by the attempted break. It is similar to the move in July, during which the initial breakout was then subject to further consolidation for a couple of weeks but from higher levels. It served as the precursor to more prominent gains in due course. Momentum is strongly configured and, having recently unwound, looks to now have renewed upside potential. The intraday breakout above $1534 means the support at $1481 is increasingly important, whilst $1492 is also a higher low. The hourly chart shows $1510 as a mid-range pivot and means that there is a band to view as a “buy zone” between $1510/$1534. This is an area for another higher low. Yesterday’s low at $1524 is initial support, whilst yesterday’s high at $1555 is initial resistance now.
WTI Oil
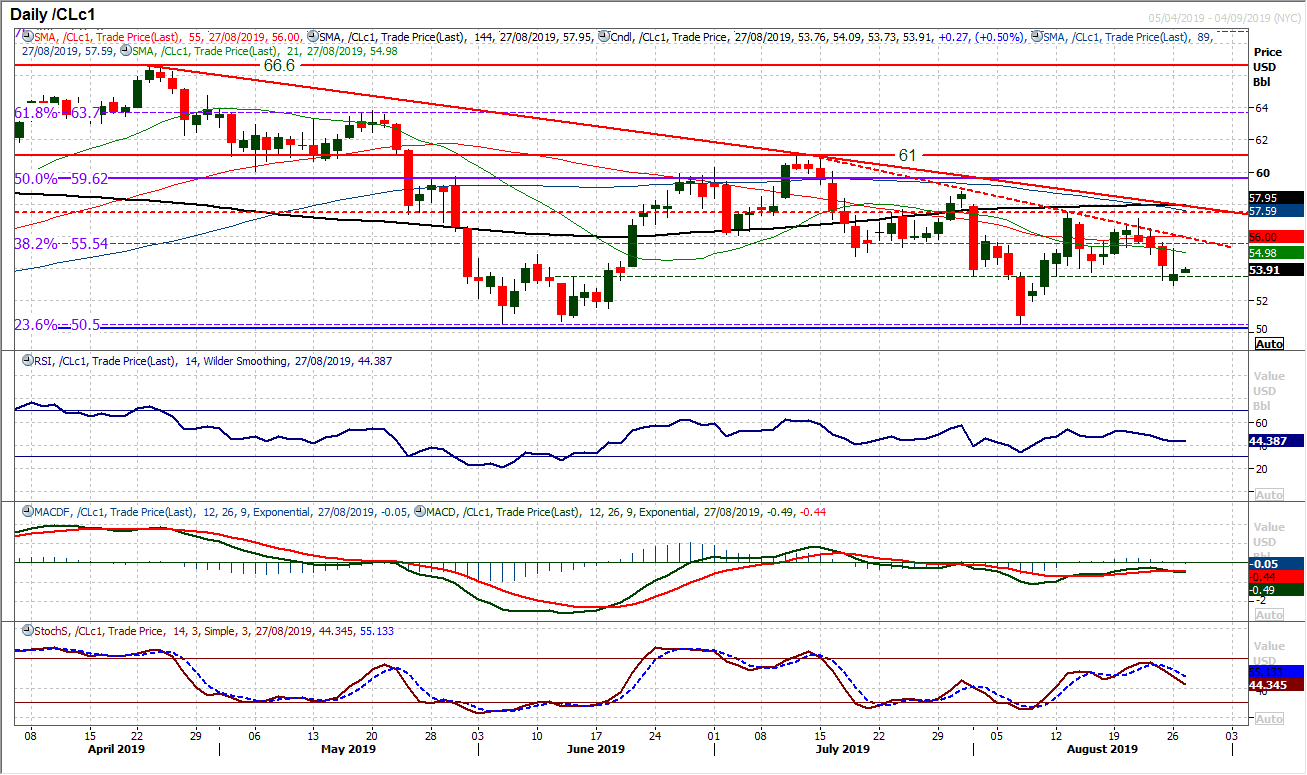
With downtrends intact over a four month and also six week basis, we continue to view near term WTI strength as a chance to sell. The six week downtrend held firm last week to contain the rally before the sellers regained control. Pushing back below the $53.75 support in the past couple of sessions may not have held on a closing basis but maintains the downside pressure. Negative candles are amassing again and yesterday’s attempted recovery turning into a bull failure candle simply re-asserts this. Momentum indicators have swung negatively again and the Stochastics are accelerating lower. The six week downtrend sits around $56.00 today with the 38.2% Fib at $55.55 again a barrier. Look to use any near term recovery today for a chance to sell as we expect further weakness back below yesterday’s low at $52.95 and a likely retest of $50.50 in due course.
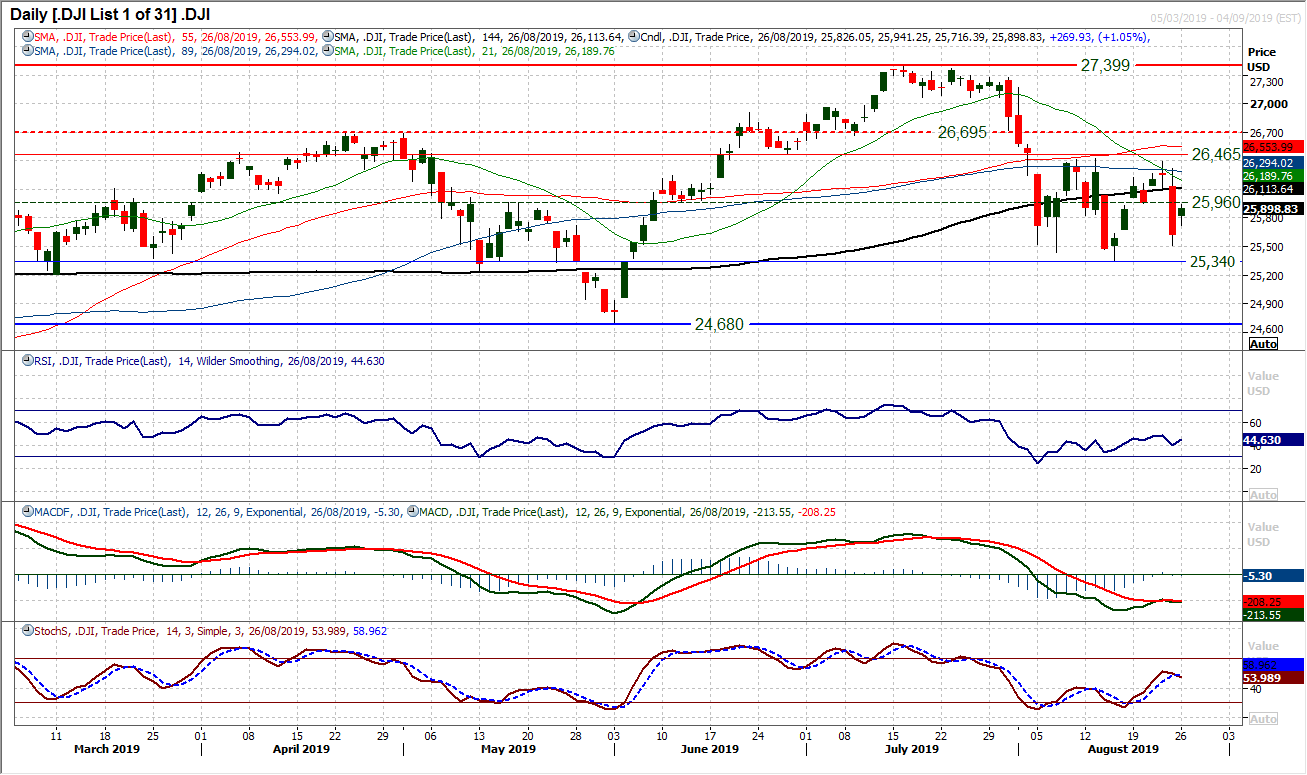
Wall Street traders do not know whether they are coming or going right now amidst the resurfacing of fluctuations over the US/China trade dispute. Friday’s sharp negative candle has confirmed the continuation of the choppy trading range between 25,340/26,425. However, it is interesting to see the market again supported in the range 25,340/25,525 as a rebound kicked in again yesterday. Momentum indicators are highly uncertain too, but reflective of the range of the past few weeks too. An old pivot within the range at 25,960 is a decent reference point for near term control within the range, but this is a highly uncertain period for the Dow. With the hourly chart showing indicators fluctuating within ranging conditions, the technicals are not indecisive. Look for a closing break below 25,340 support or above 26,465 resistance (an old pivot a shade above the recent 26,425 high) for a breakout.
"""DISCLAIMER: This report does not constitute personal investment advice, nor does it take into account the individual financial circumstances or objectives of the clients who receive it. All information and research produced by Hantec Markets is intended to be general in nature; it does not constitute a recommendation or offer for the purchase or sale of any financial instrument, nor should it be construed as such.
All of the views or suggestions within this report are those solely and exclusively of the author, and accurately reflect his personal views about any and all of the subject instruments and are presented to the best of the author’s knowledge. Any person relying on this report to undertake trading does so entirely at his/her own risk and Hantec Markets does not accept any liability. """
