Market Overview
A period of consolidation across major markets seems to be edging back towards risk aversion once more. The prospect of UK Prime Minister Johnson getting his new agreement with the EU through Parliament has been touch and go in recent days. However, with a delay to the 31st October deadline for Article 50 now surely set to be extended, the immediate prospects of getting this deal done and dusted seem highly unlikely. With markets looking for some sort of closure, the prospect of more delay and uncertainty has hit risk appetite. The initial reaction comes through on sterling which has been so strong for almost two weeks now, but is surely set for a retracement on the disappointment.
We also see safe haven assets building support this morning, with Treasury yields lower whilst the Japanese yen (and US dollar to a lesser extent) and gold showing signs of support. In the equities space the main casualty seems to be the DAX which continues its recent volatility as it is set to slide back (a lack of a Brexit deal means more uncertainty for the German export-heavy DAX). UK Prime Minister Johnson’s next move, and that of the EU27, will determine whether this minor slip into risk aversion begins to see more traction. A delay to Article 50 is needed now, but for how long? Johnson ultimately wants his Brexit deal but also a General Election (for which his party is leading in the polls). A long three month extension would give him the prospect of both, but the lengthened uncertainty would hit markets.
Wall Street closed slightly lower as corporate earnings disappointments and Brexit disappointment hit the market. The S&P 500 fell -0.4% to 2996 whilst US futures are another -0.1% back this morning. In Asia, there has been more of a mixed look, with the Nikkei +0.4% (although playing catch up off a public holiday) and the Shanghai Composite -0.2%. In Europe, the DAX futures are feeling a pinch, falling by -0.4% whilst FTSE futures are all but flat (negative correlation with GBP in play).
In forex, there is a cautious look to trading, with mild risk aversion as JPY outperforms but AUD and NZD are slipping. GBP will be in focus as European traders take to their desks. In commodities there is a basis of support for gold building, whilst oil is giving back some of yesterday’s gains.
It is a another quiet day for the economic calendar, especially for the European morning. Eurozone Consumer Confidence at 1500BST is expected to show further consolidation, and a mild tick lower to -6.7 (from -6.5 in September. The EIA Oil Inventories at 1530BST is expected to show another build in crude stocks by +1.7m barrels (after last week’s +9.3m barrels of build) whilst distillates are expected to drawdown by -2.7m (-3.8m last week) and gasoline stocks to drawdown by -2.3m (-2.6m last week).
Chart of the Day – EUR/NZD
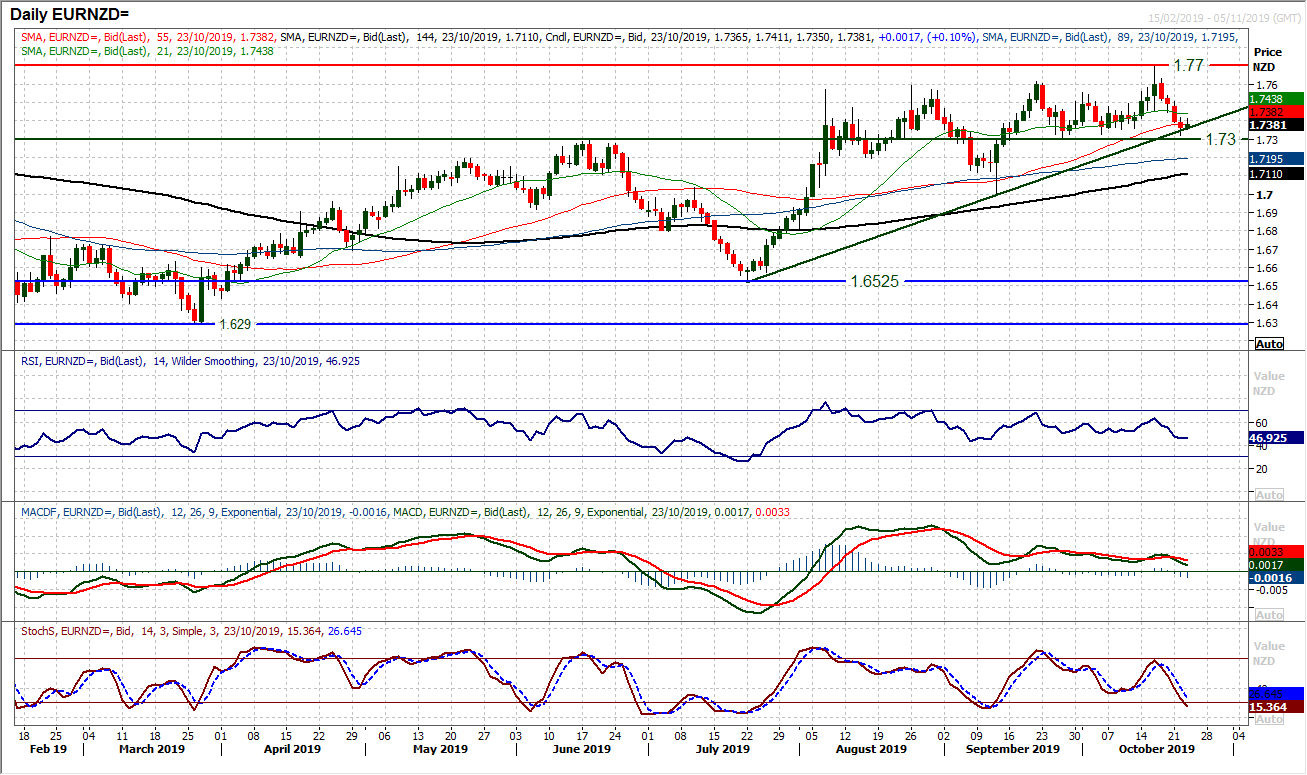
We have been seeing an improvement in the relative performance of the Kiwi in recent days, whilst the euro has begun to slip. The result of this on EUR/NZD brings the market back to a crucial crossroads again. A three month uptrend is being tested (sits at 1.7360 today) whilst the pivot support at 1.7300 is key. As the momentum indicators generate downside momentum these key levels will come under pressure. The daily RSI slipped below 50 yesterday to a five week low, whilst the Stochastics accelerate lower and MACD lines are also deteriorating. A closing breach of 1.7300 would be a five week low (effectively the RSI is calling for a downside break) and would complete a top pattern implying 315 pips of additional correction towards 1.7000 in due course. An early rebound today has been sold into and with the hourly chart showing a run of lower highs and lower lows, there is now a mini sell zone between 1.7400/1.7450. Above resistance at 1.7465 would suggest the bulls are regaining confidence again.
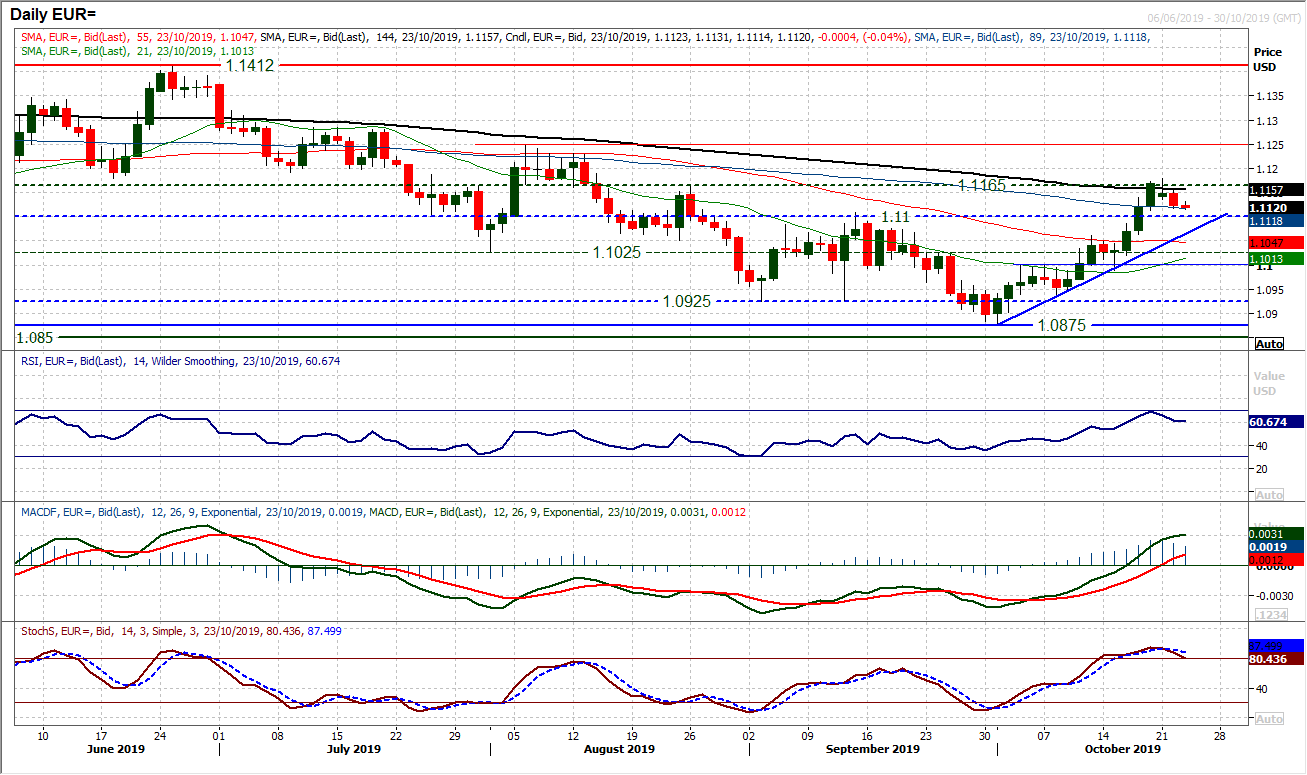
The euro rally has just begun to lose its drive and is beginning to slip back. Yesterday’s solid negative candle (which lost -25 pips) followed a close lower on Monday. The market is now pulling back for a test of the key breakout support around $1.1100. A test of the old September highs which are now supportive between $1.1075/$1.1100 will be key. The still growing three week uptrend comes in at $1.1065 today too, meaning a confluence is building. The momentum indicators will be important here. The RSI has been strong and is slipping back, but if it can hold above 50 then the bulls will be still in the driving seat. MACD lines are just beginning to wane slightly, but again, the reaction of the euro around $1.1100 and just below will be key for the near to medium term outlook. We see this as a pullback into support which will be the next potential buying opportunity, but the support needs to hold, especially with the ECB tomorrow. Resistance is building around $1.1165/$1.1180. An important period for the euro bulls.
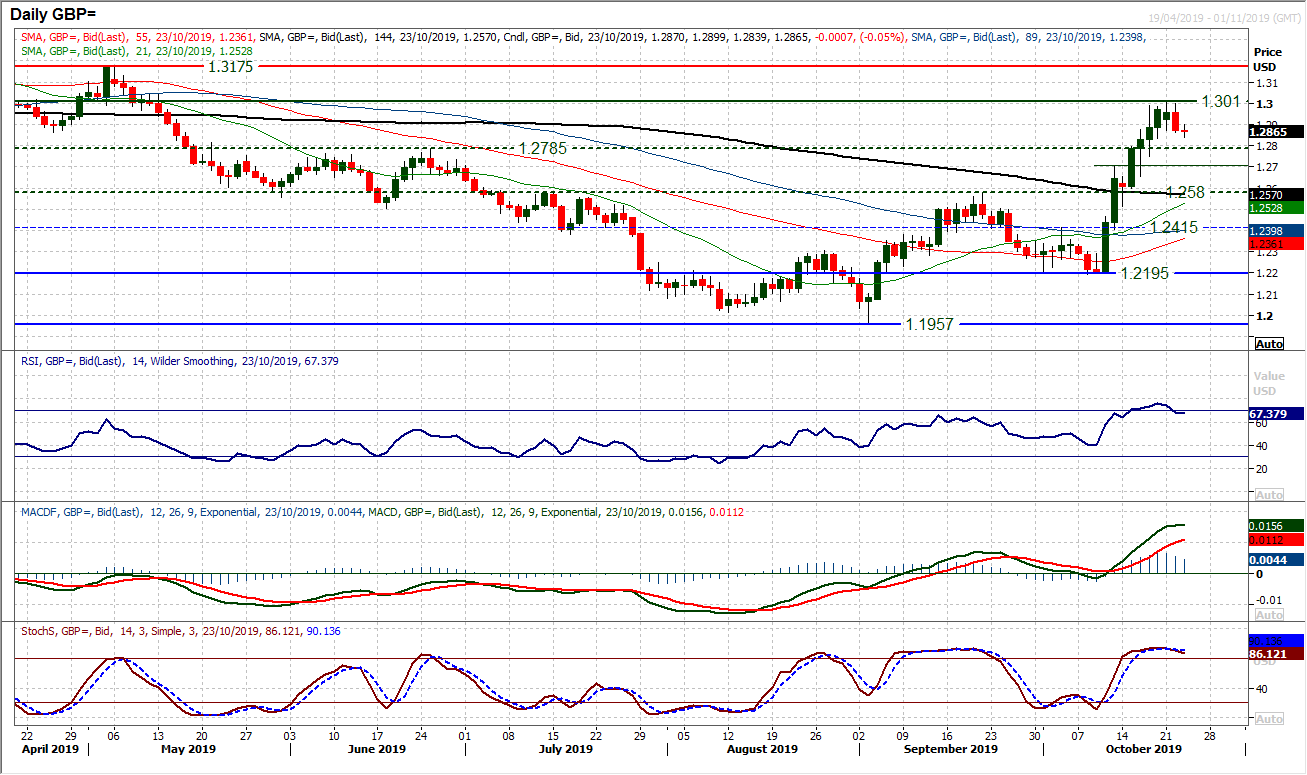
We believe that the delay to Brexit beyond 31st October (an extension to Article 50) will be a drag on Cable. The length of the delay will determine how much of a drag we see. Already the technicals show that the sterling rally is beginning to slip back. Where previously the market consistently bought into weakness, the sentiment has shifted. Yesterday’s negative candle came with a breach and close below Monday’s low. A retracement is now on. The hourly chart shows a small 135 pip top pattern completed to imply a retreat towards $1.2750 now. This suggests that the old breakout at $1.2785 will be at least tested. There are other supports at $1.2700 (minor) and more considerably $1.2580 (old key summer resistance). Momentum is beginning to sag too, with the RSI below 70 (having been above 74, a move below 60 would now be corrective), whilst the Stochastics are also beginning to weigh down. The hourly chart shows $1.2875/$1.2900 forming as a basis of resistance overnight, whilst hourly momentum is becoming correctively configured.
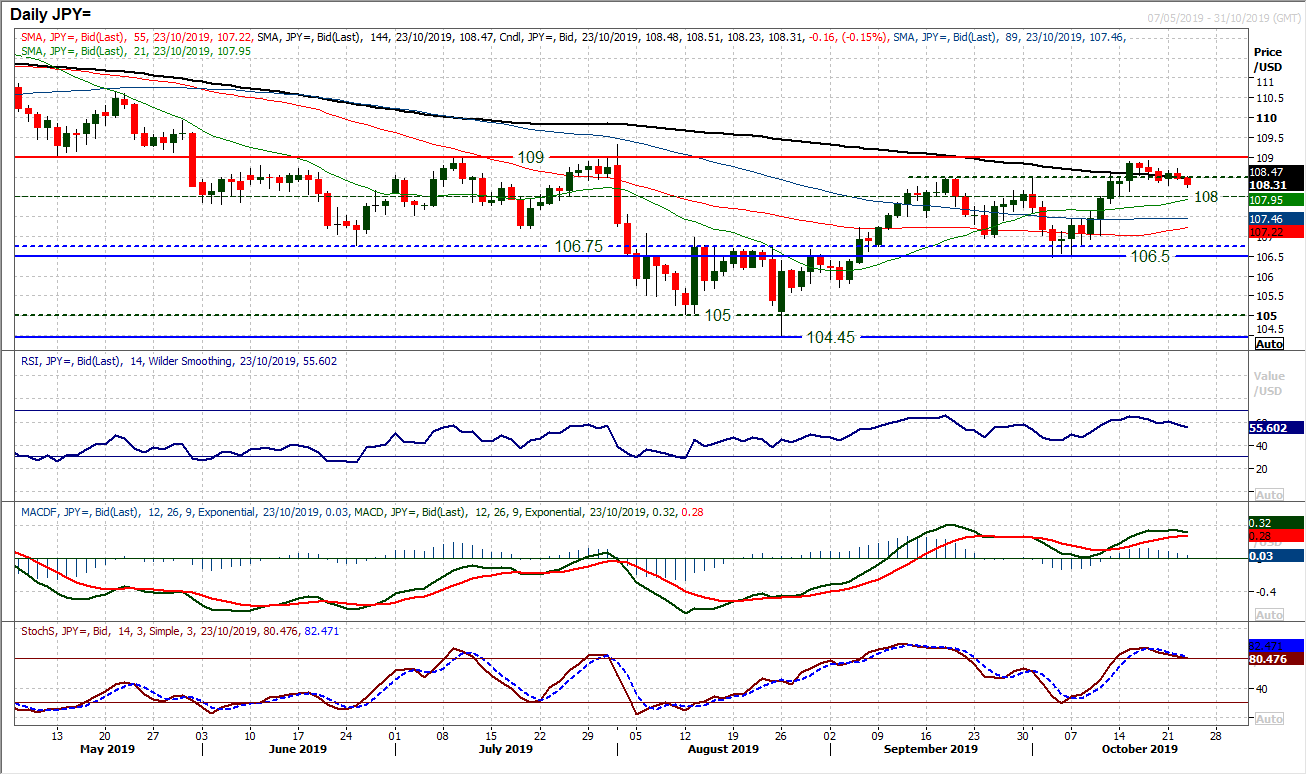
Another session of consolidation around 108.50, but the negative candles are beginning to rack up and the selling pressure is mounting. Although trading around the old September highs suggests that near to medium term outlook remains in the balance, intraday failures are beginning to weigh on the market. The hourly chart shows a broken two week uptrend, whilst hourly indicators have gradually slipped into a negative bias. The hourly RSI is now falling below 30 whilst MACD and Stochastics sit more correctively configured. Breaching Monday’s low at 108.30 has reflected this growing pressure this morning. However, if there were to be a breach of 108.00 then the outlook would be turning decisively corrective once more within what is becoming a range between 106.50/109.00. There is mini resistance at 108.70 under last week’s highs of 108.95 which is underneath the bigger pivot resistance of 109.00.
Gold
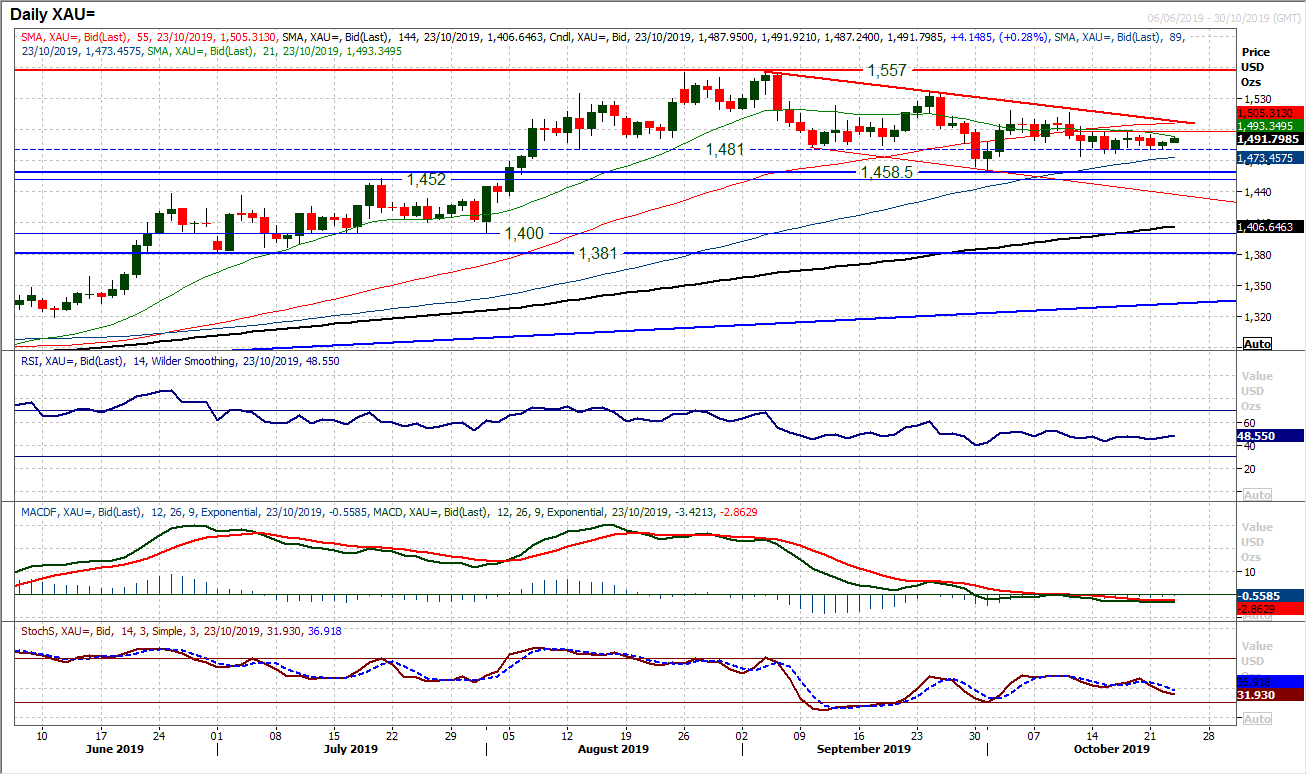
The consolidation of the past seven sessions which has traded in a tiny range of $23 continues. Support at $1474 is holding, with resistance at $1497. There is a very slight negative drift given the pressure on supports in the run of lower highs. Also with the mild negative bias on momentum indicators (RSI slipping under 50, MACD lines a shade under neutral and Stochastics turning lower), this is pointing towards a test of the $1474 support. However, once more a close under $1481 which was an old support remains elusive. This has repeatedly been defended in recent months into the close and again in recent sessions. A mild tick higher into the close yesterday and holding today simply reiterates the consolidation. This is reflected in the hourly chart which shows RSI having just gone back above 60 for the first time in a few days, whilst hourly MACD lines are positioned around neutral again. A market desperately in need of a catalyst.
WTI Oil
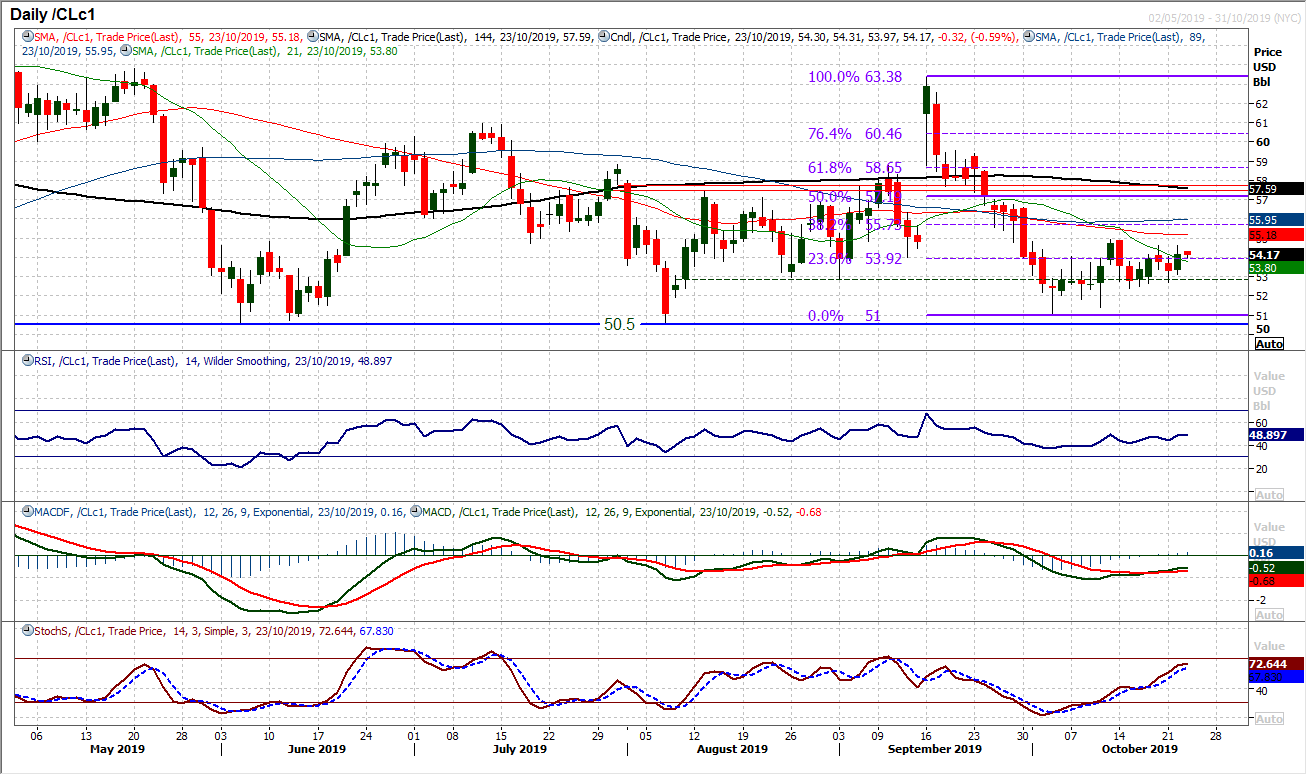
The run of mixed signals continues on oil. Yesterday’s positive close added around 1.5% to the price of WTI but is it enough to break the shackles of what is now an increasingly choppy consolidation? The move has stalled slightly today, with initial resistance at $54.60 still intact. Trading around the 23.6% Fibonacci retracement (of $63.40/$51.00) at $53.90 leaves the rally uncertain. There is a slight edge higher on MACD and Stochastics lines, but RSI remains stuck under 50. A continues failure under $54.60 would only help to bolster the barrier of $54.60/$54.90. Posting a second positive candlestick today would certainly suggest an improving outlook beginning to develop, but until $54.60/$54.90 resistance is breached, it is a little difficult to take conviction from a market that has had several false starts in recent weeks.
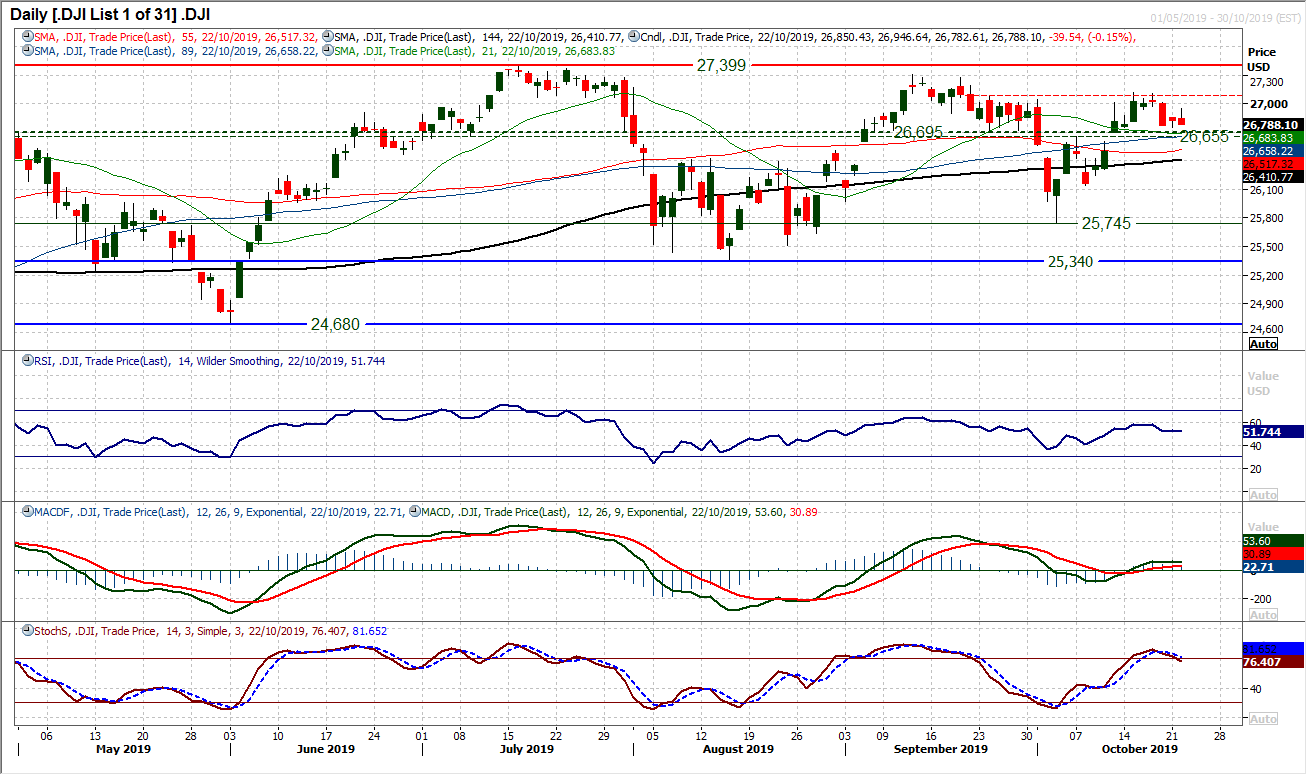
The Dow is giving off a range of mixed signals. The bulls would argue that the market is holding above the old pivot band 26,655/26,695 which is a basis of support. The RSI is also holding above 50 and MACD lines above neutral. However, this is a market once more looking over the edge at a potential correction again. Whilst closes have been mixed, the past four candlesticks have had closes below opening levels (leaving negative looking one day patterns. Yesterday’s initial rebound was also decisively sold into for the market to close all but at the day low. The Stochastics momentum indicator is the most sensitive to near term moves, playing off where the market closes on an intraday basis. The Stochastics have crossed lower and are near to a sell signal. The pressure is growing on the support. Monday’s low around 26,745 is the initial gauge, but a closing breach of 26,655 would open 26,400/26,425 as the next support area. Yesterday’s high at 26,945 also now is a potential lower high.
"""DISCLAIMER: This report does not constitute personal investment advice, nor does it take into account the individual financial circumstances or objectives of the clients who receive it. All information and research produced by Hantec Markets is intended to be general in nature; it does not constitute a recommendation or offer for the purchase or sale of any financial instrument, nor should it be construed as such.
All of the views or suggestions within this report are those solely and exclusively of the author, and accurately reflect his personal views about any and all of the subject instruments and are presented to the best of the author’s knowledge. Any person relying on this report to undertake trading does so entirely at his/her own risk and Hantec Markets does not accept any liability. """
