Market Overview
There is an increased fear of the economic impact of the rapidly spreading Coronavirus. With the death toll in China climbing to 80 amid thousands of cases of infection, with the virus severely impacting on the Chinese economy and the Lunar New Year celebrations. Over 40% reduction in civil air transport and rail travel, there is also an impact of how this impacts on global supply chains will be impacted by what is now 30 Chinese cities being on level 1 lockdown. Furthermore, this is not a problem that will peter out in a couple of days. With an incubation period for the virus of up to two weeks, these lockdowns in China could last for several weeks.
There is the usual risk negative impact on major financial markets. Bond yields continue to fall, with the US 10-Year yield under a key 1.700% and at three and a half month lows. Other safe haven plays are also in favour, with the Japanese yen and gold gaining ground. Higher risk plays are also suffering, with the oil price sliding sharply, Aussie and Kiwi pressured in the forex majors and equities also beginning to accelerate. Is this the moment that Wall Street finally begins to correct decisively?
Wall Street closed strongly lower on Friday with the S&P 500 -09.% and with US futures a further -1.0% lower, the Asian markets which are open (several shut for the Lunar New Year) have been hit hard. The Nikkei 225 was -2.0% lower. In Europe, there is a key bout of corrective pressure too, with the DAX Futures and FTSE 100 Futures both around -1.4% lower.
In forex, there is a mixed USD outlook, but risk aversion is the main theme. JPY is the main outperformer, whilst the commodity currencies (AUD, NZD and CAD are all under pressure).
In commodities, gold is around +0.5% higher (c. +$7) with oil once more sharply lower by over -2%.
The German Ifo will be watched early today but also watch out for New Home Sales in the afternoon. The German Ifo Business Climate for January at 09:00 GMT is expected to improve to 97.0 (from 96.3 in December) with the Ifo Current Conditions component improving to 99.2 (from 98.8) and the Ifo Expectations component improving to 98.0 (from 93.8).
US New Home Sales are at 15:00 GMT and are expected to improve by +1.7% to 728,000 in December (up from a growth of +1.3% to 719,000 in November).
There is also a speech from FOMC member John Williams (voter, centrist) at 14:30 GMT.
Chart of the Day – USD/CHF
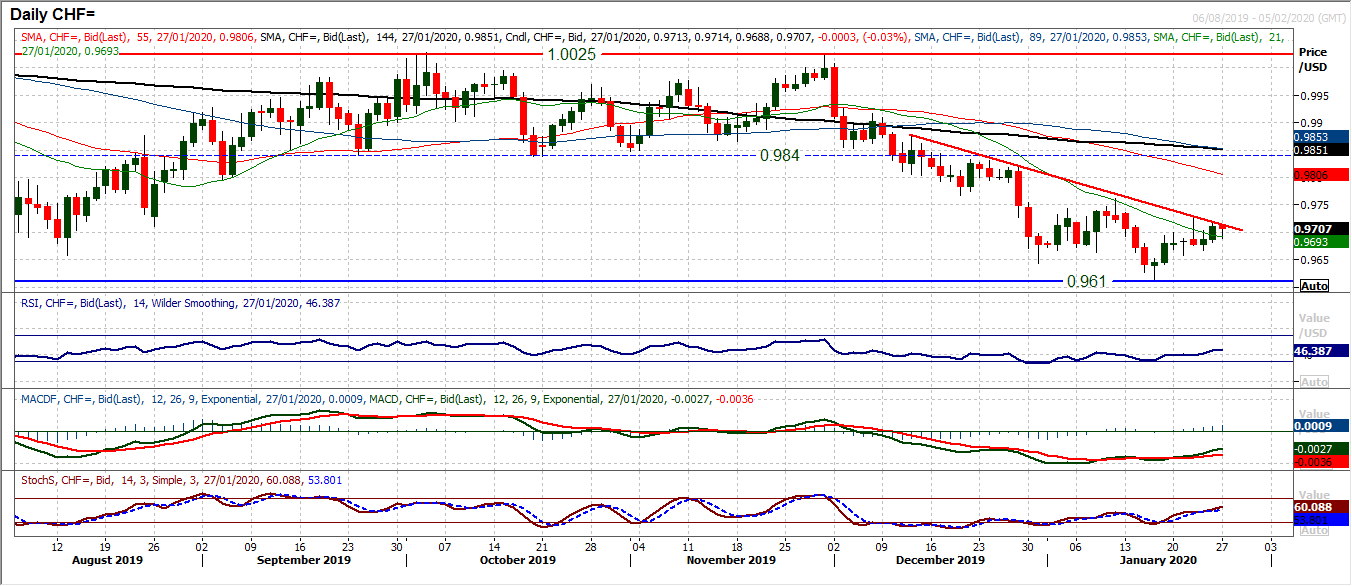
The Swiss franc has started to how signs of looking more corrective in recent sessions and this is bringing USD/CHF to a test of a key downtrend. A second successive positive candle into the close on Friday means that the pair is testing resistance of a six week downtrend. A breakout above initial resistance at 0.9730 (last week’s high) would signal a breakout and open the key lower high at 0.9760. It is the momentum indicators which are leading the market higher, with Stochastics and the RSI at seven week highs, whilst MACD lines are advancing following a bull cross. The outlook for a recovery is building. With regards to support, there is a run of higher lows now beginning to form following the 0.9610 key low, with support around 0.9660/0.9665 developing. A closing move above 0.9730 would be the signal that the bulls are really gathering pace in a recovery.
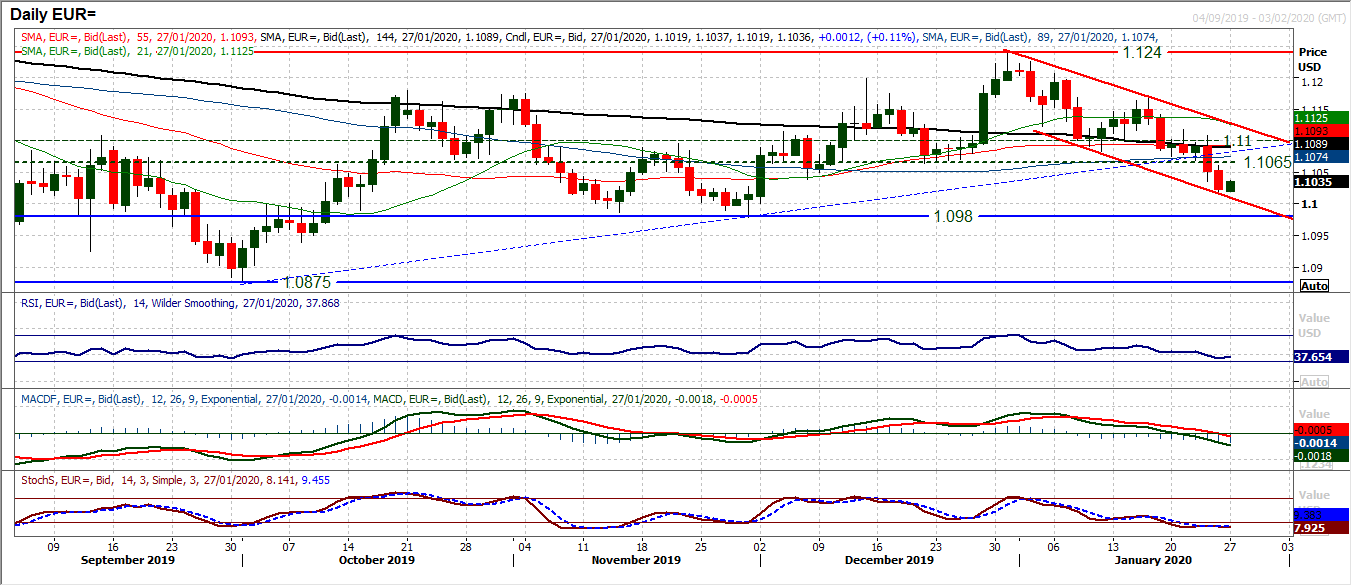
The outlook for the euro remains under pressure even though there has been a degree of stabilisation this morning. The track lower within the downtrend channel has continued with a run of bearish candles. There have now been five bear candles in the past seven sessions, but even when the bulls have managed to do something, it is only been through marginal gains. Intraday rallies are a chance to sell. Even early gains today have been given back. This is reflected through momentum indicators with the MACD lines now sliding decisively below neutral, Stochastics in deep bear configuration and RSI at near four month lows below 40. There is now band of resistance overhead, with $1.1065 starting a key area of sellers between $1.1065/$1.1100. Pressure towards a test of the November lows and support around $1.0980/$1.1000 is preferred now.
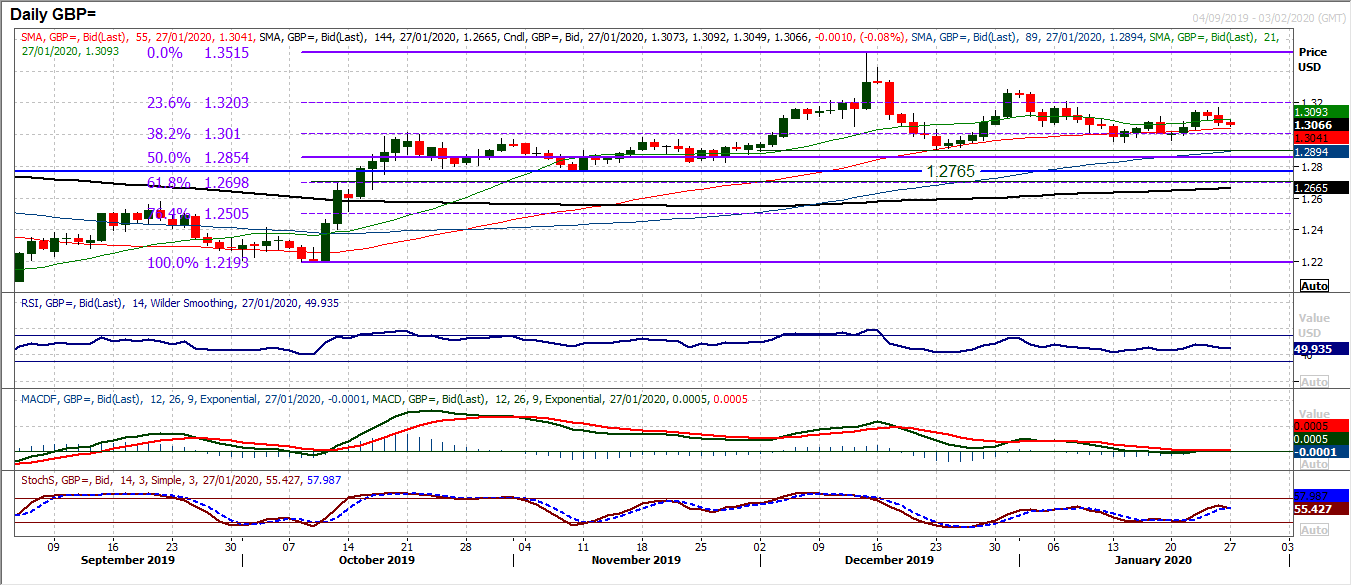
Once more we have seen an attempted recovery on sterling falter. This has been a feature on Cable in recent weeks where recoveries from the medium term support band $1.2900/$1.3000, which have left key lows at $1.2950 and $1.2960 in the last two weeks, have just been unable to get ahead. After Friday’s negative candle once more turned the bulls backwards, there is a mild negative bias forming that could once more see Cable being dragged back into $1.2900/$1.3000. There is little real direction to go on, as the RSI is effectively now just oscillating tightly around 50, MACD lines have flattened at neutral. Only the Stochastics which are again crossing lower today give a signal, with a slight bear bias. Resistance has been left of Friday’s high at $1.3170, whilst the hourly chart shows a near term pivot around $1.3090 forming. The hourly chart shows initial support at $1.3030. We are still focused on Cable finding support around $1.2900/$1.3000 over a medium term basis, but again there is lack of real direction.
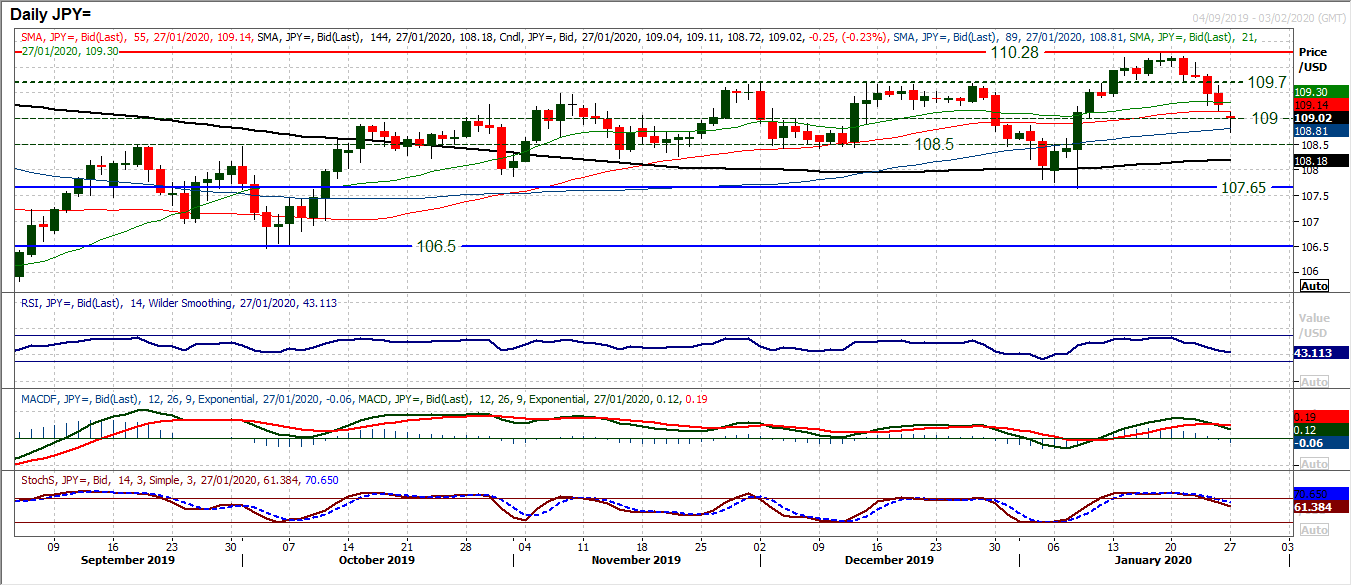
Downside momentum is growing on Dollar/Yen now as the breakout from earlier in January quickly retraces. We first thought of the old medium term pivot at 109.00 being a basis of support, but there are old lows around 108.50 to provide us with an important 108.50/109.00 support band. With momentum indicators increasingly corrective, this band of support will be key. Quickly this morning, early moves have slipped to 108.70 but in thin trading of the (Lunar New Year impacted) Asian session. The reaction as the European’s take over will give more of an indication. The technical deterioration is now being met with confirmed sell signals positing on Stochastics and MACD lines (following confirmed bear crosses on both). The RSI has also now fallen back below 50 and is now sitting in the 35/45 area where corrections have dropped back to in recent months. The hourly chart shows 109.20 as an old pivot resistance area now, with 109.65/109.70 key. We still favour selling into intraday rallies for now.
Gold
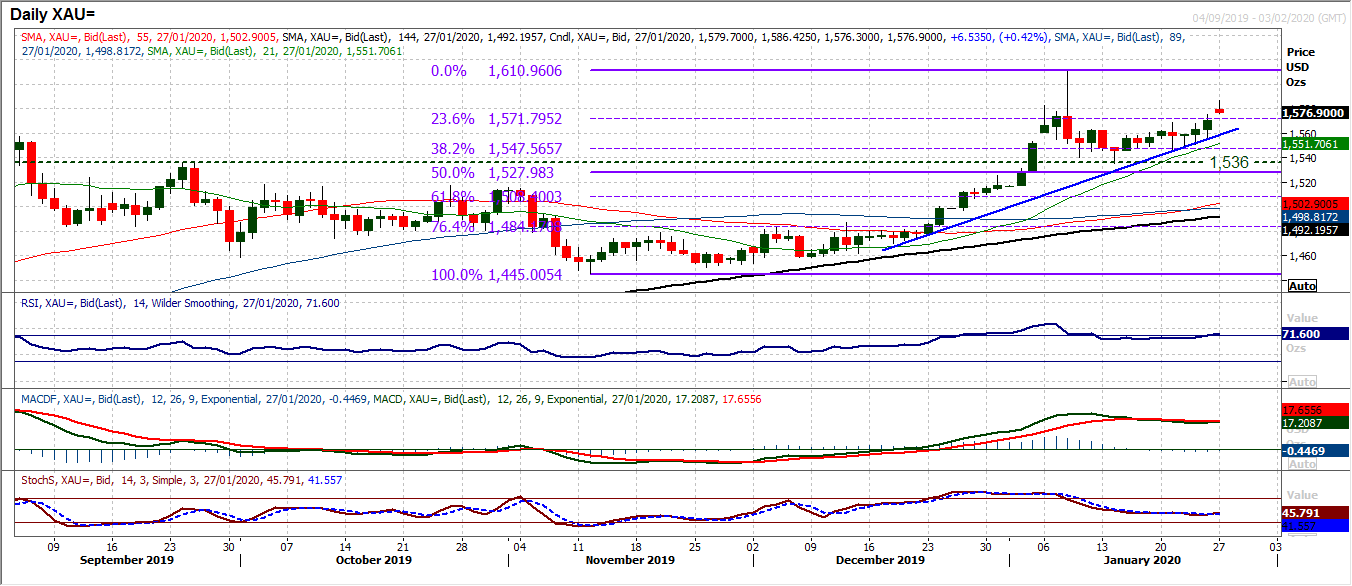
The bulls have been preparing for the next breakout over the past week and on Friday they seem to have been given the green light to go. Using support of the 38.2% Fibonacci retracement (of $1445/$1611) intraday weakness has been consistently bought into to form a five week uptrend. This uptrend (today at $1558) has been used as the springboard for a closing breakout above $1568 resistance. Give today’s opening gap higher, this now seems to be releasing the shackles for the next bull leg higher. Closing clear of the 23.6% Fibonacci retracement at $1572 would be another feather in the cap, and would then effectively re-open $1611, which is January’s multi-year high dating back to March 2013. Friday’s high of $1575 is initial gap support, but intraday weakness is now a chance to buy. Momentum is now swinging higher again on RSI (above 70) whilst MACD and Stochastics are also setting up for a positive shift.
WTI Oil
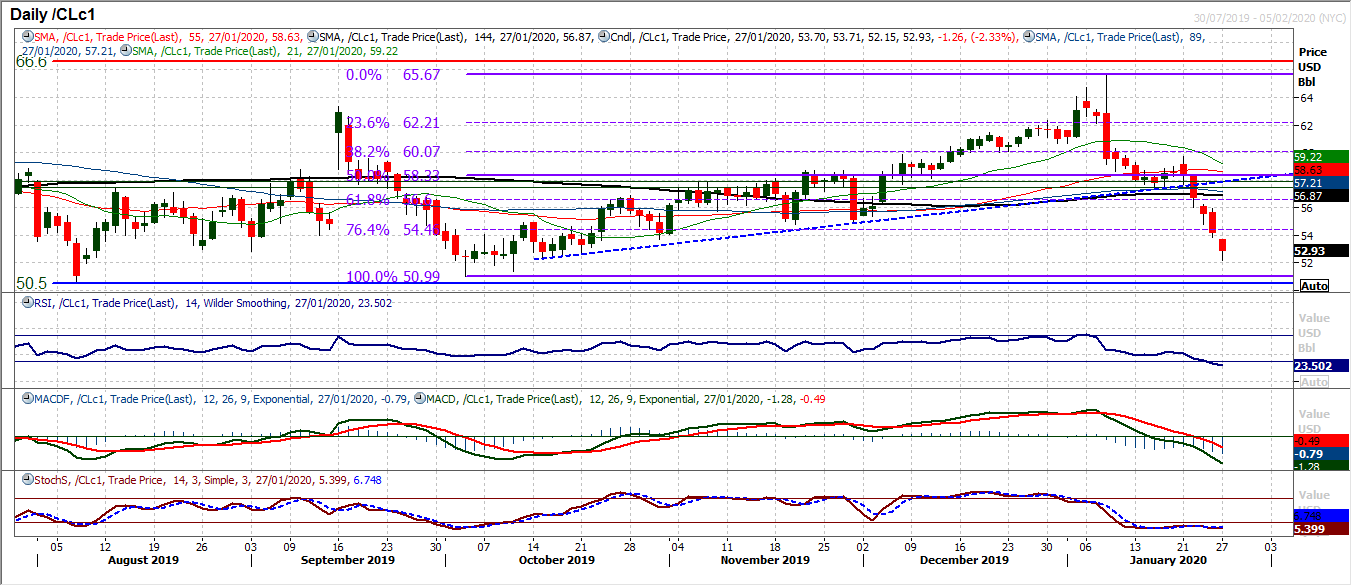
It has been a remarkable correction on oil in the past two and a half weeks. Retracing the run higher of the US/Iran dispute has been sharp and has accelerated lower in the past week. Downside below the 76.4% Fibonacci retracement (of $51.00/$65.65) at $54.45 really does suggest a full retracement to $51.00. Another downside gap this morning as momentum accelerates. Intraday rallies are a chance to sell. The initial gap at $53.85, before $54.75/$56.00 are resistance levels. Support is tending to matter little right now, with today’s low at $52.15 before the major, long term support at $50.50/$51.00.
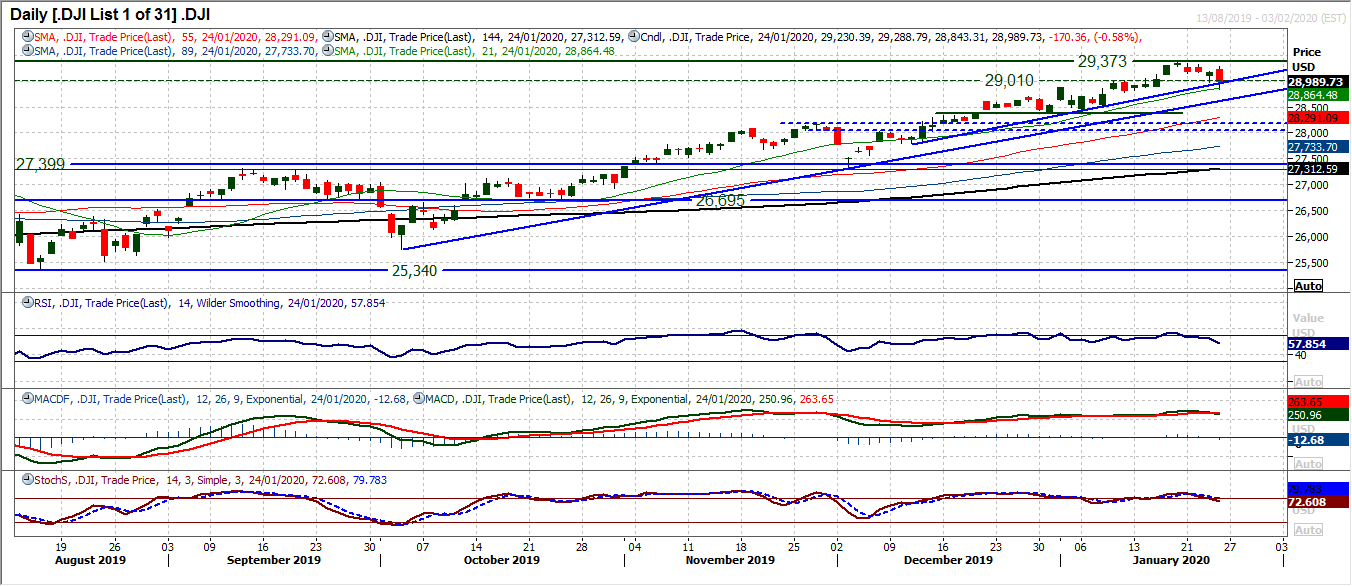
With fear over the impact of the spreading Coronavirus, the Dow is suddenly looking vulnerable to a correction. There have now been three negative candles in the past four sessions and Friday’s bearish outside day looks to be the set up for an early slide this week. The support band 28,789/29,010 is likely to be breached today (if the futures of around -1% are correct around the open, whilst the market would also then break the six week uptrend. Of more pressing importance would be a three and a half month uptrend which is supportive at 28,650 today. Already too, it looks as though the momentum indicators are threatening lower. Whilst MACD and Stochastics have slipped back in recent sessions, it is the RSI at six week lows which is the worry. The RSI below 50 would be a negative signal too. The big support of the first real reaction low comes in at 28,376. For today’s session, what is likely to be an old support (on a likely downside break) of 28,789/29,010 is now a basis of resistance.
DISCLAIMER: This report does not constitute personal investment advice, nor does it take into account the individual financial circumstances or objectives of the clients who receive it. All information and research produced by Hantec Markets is intended to be general in nature; it does not constitute a recommendation or offer for the purchase or sale of any financial instrument, nor should it be construed as such.
All of the views or suggestions within this report are those solely and exclusively of the author, and accurately reflect his personal views about any and all of the subject instruments and are presented to the best of the author’s knowledge. Any person relying on this report to undertake trading does so entirely at his/her own risk and Hantec Markets does not accept any liability.
