Market Overview
There has been a notable shift in risk appetite in recent days. For now, positive sentiment is in something of a sweet spot and this is driving traders away from safety and towards higher risk assets. With renewed monetary easing across a swathe of major central banks (PBoC, Fed hints, ECB ready), the mood music surrounding the US/China trade dispute has been notably more positive in the past week. Reuters reports out of Germany suggest that there are moves being made towards a package of fiscal stimulus. Even the UK Parliament has legislated to force Prime Minister Johnson apply for another extension in the event that no deal is achieved before 31st October (already extended once) deadline for Article 50. So we see broad risk appetite improving and a decisive move away from the previously strong performing safe havens. The 10 year Treasury yield is now over 20 basis points off its 1.42% nadir. The Japanese yen is weakening, whilst gold has also turned corrective $70 off its multi-year high of $1557. Even sterling, which has been a massive dog in recent months, is on the rebound (although this has significant implications for the outlook for UK equities – see our Chart of the Day). There may be a slight sense of consolidation across forex majors this morning, however, the key shift in risk appetite is still playing out on commodities with a breakout on oil and losses on gold. In the absence of any trade dispute curve balls, this positive mood looks set to last at least into the ECB on Thursday.
Wall Street closed all but flat on the day with a loss of less than a tick at 2978, whilst a mild sense of consolidation is across US futures which are -0.1%. There is a mixed look to Asian markets with the Nikkei +0.2% whilst Shanghai Composite is -0.2%. In Europe, there is a mild slip back with FTSE futures and DAX futures both around -0.1% lower. In forex majors, there is a lack of direction, but the JPY weakness is continuing as is the rebound on GBP. In commodities, the recent trends of the past week continue, with gold half a percent lower whilst oil is just under half a percent higher.
UK employment is key for the economic calendar this morning. At 0930BST UK Unemployment is expected to stick at 3.9% in July, with the claimant count expected to increase by +30,000 in August (+28,000 in July). UK wage growth, measured through Average Weekly Earnings are expected to remain at +3.7% in July (+3.7% in June). The US data is restricted to US JOLTS jobs openings at 1500BST which is expected to drop slightly to 7.31m in July (from 7.35m in June).
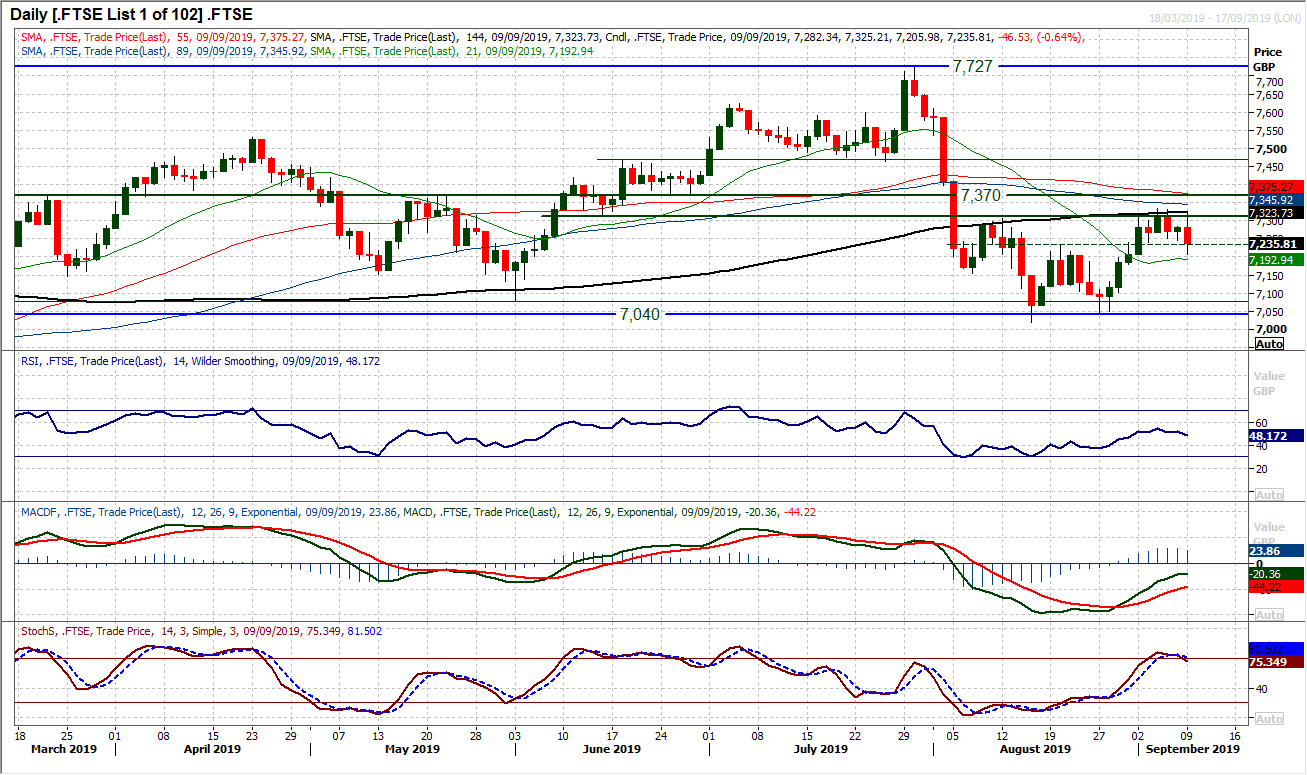
Chart of the Day – FTSE 100
The big blot on the copybook of a recovery in equity markets is the ongoing disappointment that is FTSE 100. A negative correlation with a sterling recovery is a prominent factor behind why FTSE has completely missed out on the equities rebound. Now we see the technicals on FTSE 100 are also now working against the market. Resistance between 7316/7370 has been a barrier since early August, however, there are a number of negative signals now coming through with yesterday’s 47 tick decline. With the overhead supply again weighing on the index, failing at the resistance of the 144 day moving average, a bearish engulfing candlestick has ended a week long consolidation, opening for weakness. The bulls have hung on to a near term pivot at 7230 into the close last night, but warning signs are there. A Stochastics sell signal has been seen (and could be confirmed today) as RSI turns back below 50. The hourly chart is also turning increasingly corrective on hourly RSI and MACD. Failure under 7235/7245 resistance today will weigh on the index. Consistent trading below 7230 would now re-open the support band 7040/7080.
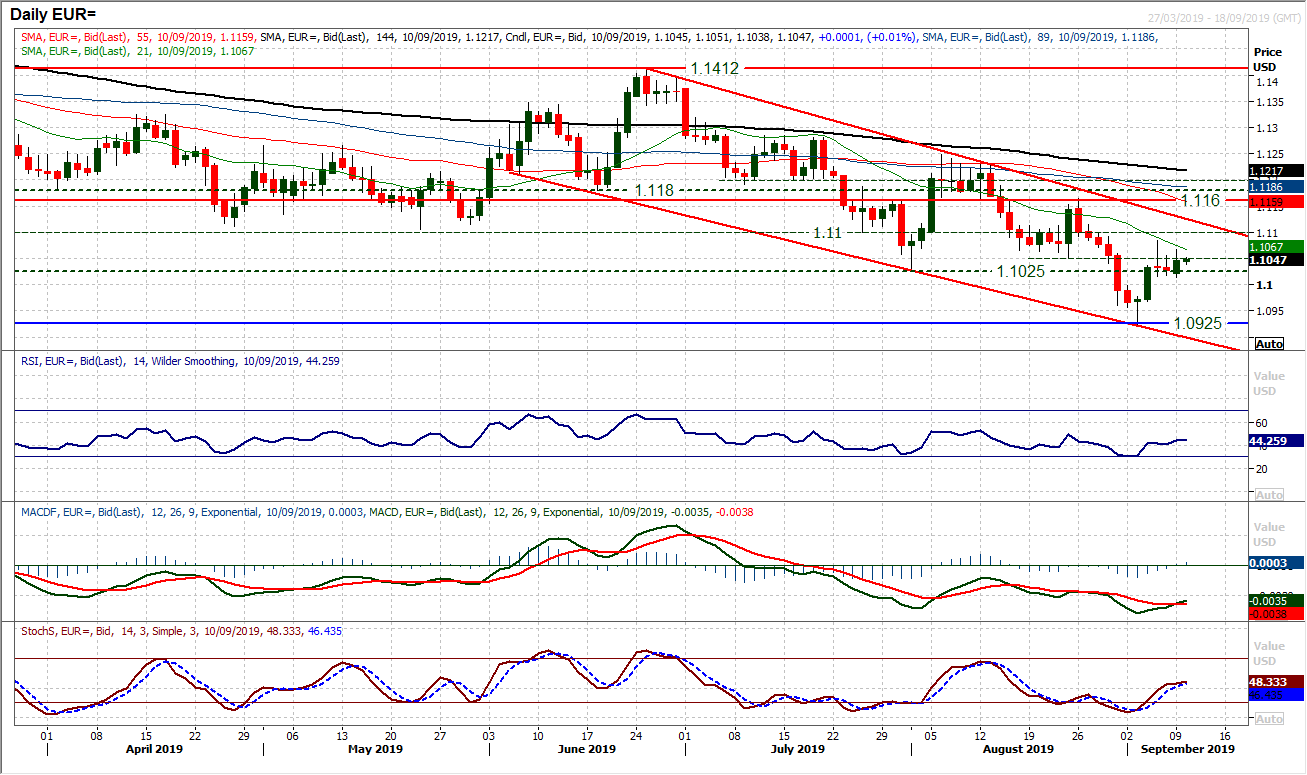
The euro ticked higher yesterday but essentially remains stuck under the resistance band that is forming of the old lows $1.1025, $1.1050 along with last week’s high at $1.1085. With the negative medium term configuration on EUR/USD, there is still a suggestion that the rallies will fade and will be used as a chance to sell. Within this medium term downtrend channel, the 21 day moving average (c. $1.1065 today) has been a gauge (even if not always accurate) of resistance. According to the RSI which sees rallies consistently failing around 50/53 there is room for a tick higher again, however we would treat rallies with caution now. The ECB is lurking (on Thursday) and this could restrict appetite to take a view. The hourly chart is increasingly ranging between $1.1010/$1.1085.
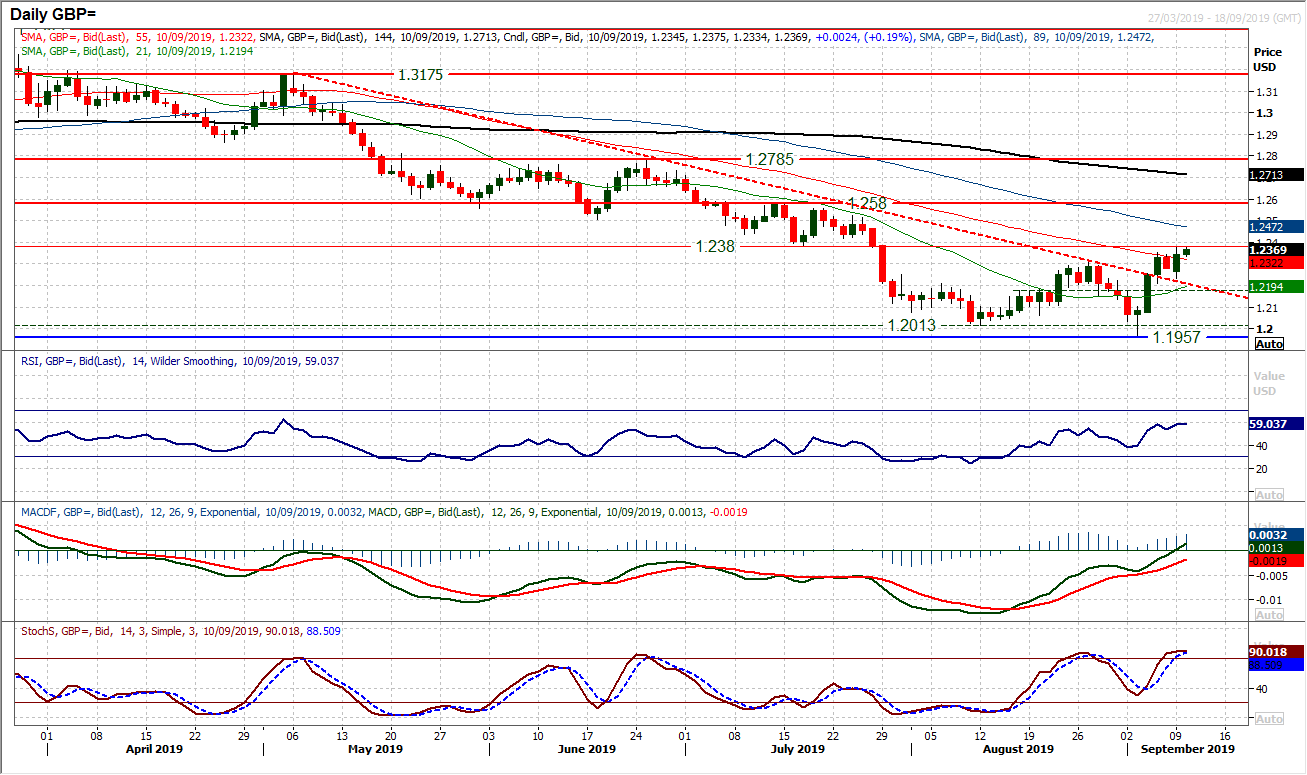
Sterling looked to push on once more yesterday with a bullish outside day session as Cable hit a six week high. The market had a look at the initial resistance at $1.2380 and just backed off slightly, but the outlook retains its improving configuration. Using the topside of the old four month downtrend as a basis of support yesterday was positive, leaving a higher low at $1.2230, whilst the market continues to look to build above $1.2305 and the old August highs. Momentum is also building positively as the RSI holds above 55 at four month highs and MACD lines edge ever closer to rising above neutral. Although there has to be an element of the unknown about sterling (due to Brexit newsflow and the turbulent nature of UK politics) there is a sense that sterling has at least for now turned a corner. A close above $1.2380 opens $1.2580 as the next band of support in the recovery. Taking the breakout above $1.2305 as a base pattern, the implied move suggests $1.2580 remains a realistic rebound target in the coming weeks.
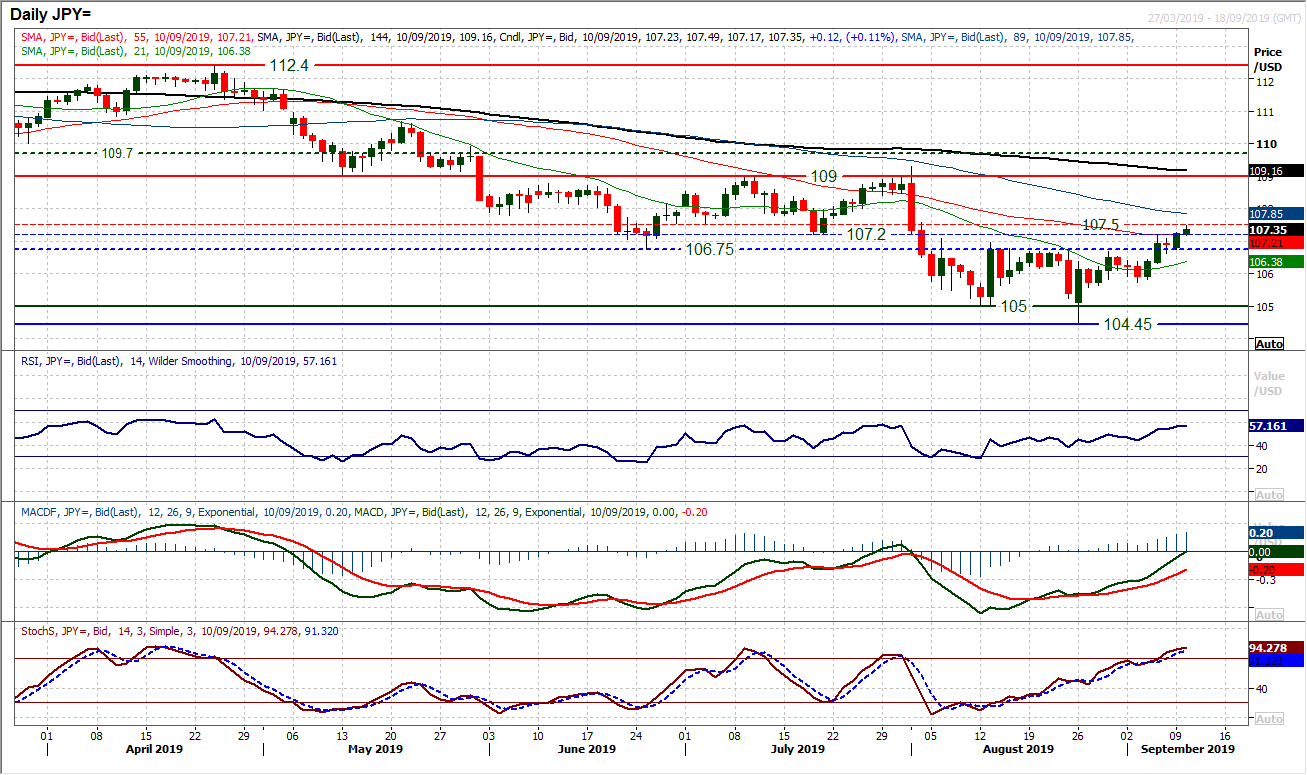
A bullish candlestick trading entirely above the 106.75 pivot which is now supportive helps to add to the improving outlook on Dollar/Yen once more. The momentum indicators continue to improve and are now on the brink of a decisive positive configuration which would suggest this is something more than simply a bear market rally. A move above 60 on RSI and above neutral on MACD lines is required for this traction to be sustainable. On price the break above 107.20 (last week’s high and old July low) adds confidence, but confirmation of a close above 107.50 would be needed. Until this is all seen the rally needs to be treated with cautious optimism. The hourly chart shows the band 106.75/107.20 is now a basis of support and another higher low in this band would be an opportunity. A close above 107.50 opens 109.00.
Gold
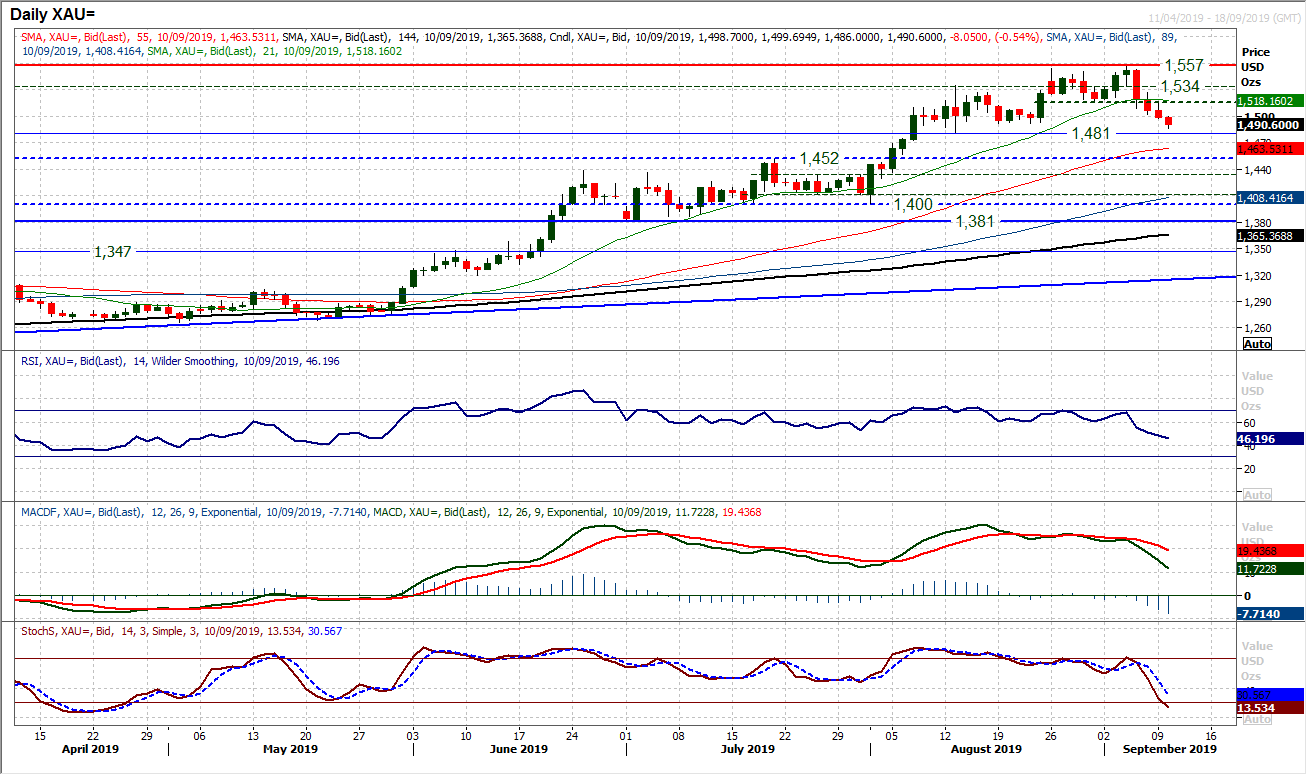
Forming three decisive negative candles in a row, the corrective move on gold is gathering pace. Supports formed during the big run higher of recent months are now being broken, whilst momentum is turning increasingly negative near term. The RSI is now decisively falling below 50 at three and a half month lows, whilst Stochastics accelerate into negative configuration and MACD lines show the bears increasingly in control. The market closed below $1500 last night (psychological) whilst has also broken support at $1492 today. A breach of the key support at $1481 would really suggest corrective momentum fully taking hold and a move back towards $1400/$1452 would be possible. The hourly chart lays out lower highs and lower lows now forming, leaving resistance initially at $1502/$1515. Hourly momentum shows selling into strength now, with hourly RSI struggling 50/55 and hourly MACD below neutral.
WTI Oil
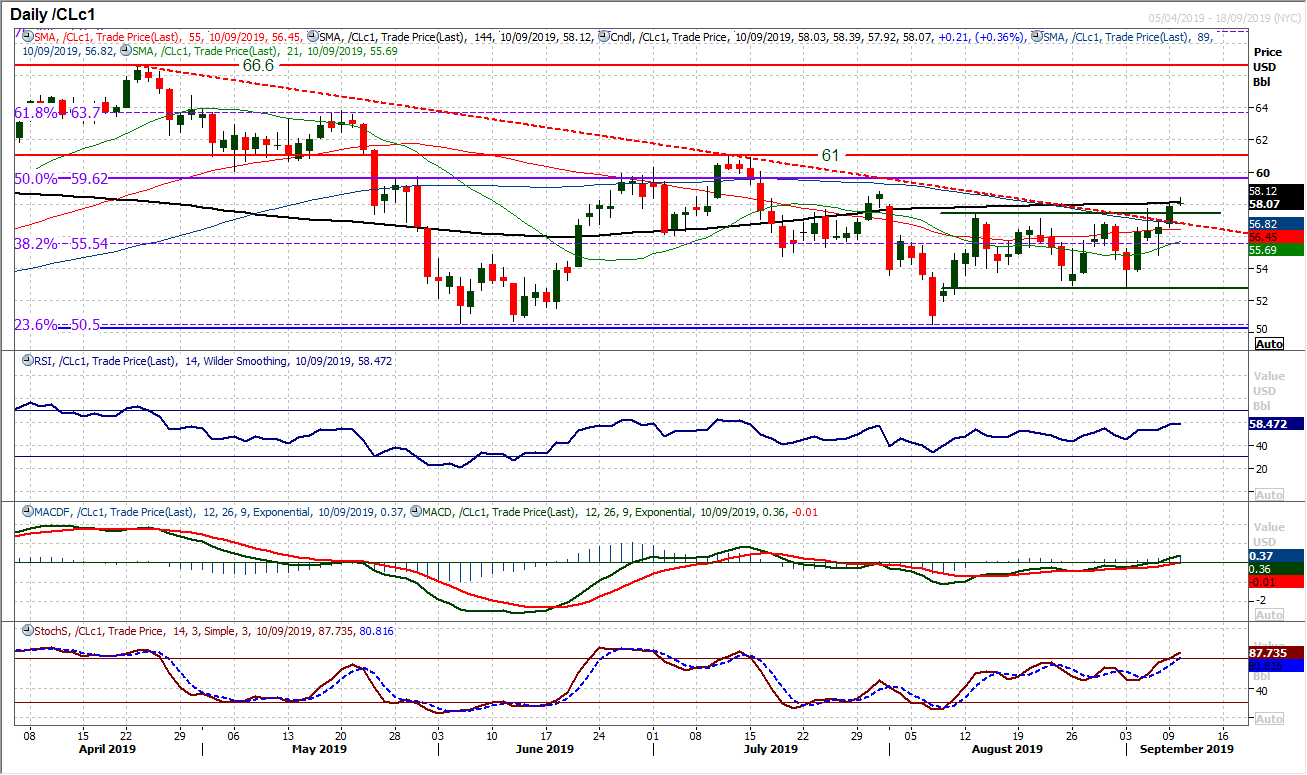
After a few days of testing resistance, oil is finally breaking higher. The outlook has been steadily improving in recent sessions and yesterday’s decisive bull candle closing above the resistance at $57.50/$57.75 opens the recovery gains now. Clearing a consolidation rectangle the market now has an implied move to retest the key resistance of $61.00. The RSI and Stochastics are both confirming the breakout at eight week highs, whilst MACD lines are edging above neutral. Near term weakness is now a chance to buy with breakout support between $56.90/$57.75. A move above the $58.80 July high would really open the recovery.
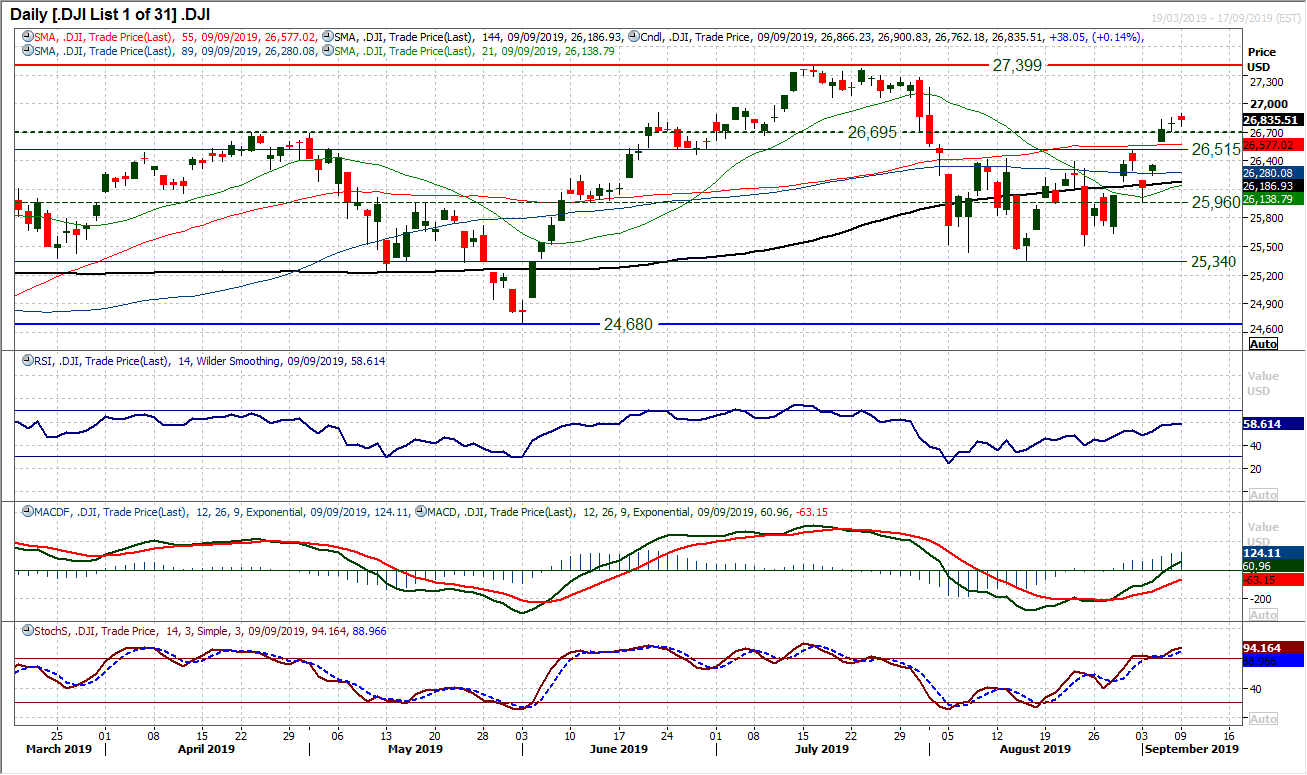
The Dow continues to breakout to new one month highs and drive an improving outlook. Breaking decisively clear of the base pattern (which has neckline support band now 26,425/26,515) the market is now developing well in its implied retest of the all-time high again at 27,399. There is a continued move towards a positive outlook on momentum indicators with the RSI into the high 50s, Stochastics rising above 80 and MACD lines set to accelerate higher above neutral. Intraday weakness is a chance to buy. The only caveat would be that the past couple of daily candlesticks have not been bullish, even though the market has closed higher on each occasion. There is support between 26,425 and the old pivot level at 26,695. We would look for any unwind into here to be supported and used as a chance to buy. There is initial resistance 27,069/27,280 protecting the 27,399 all-time high.
"""DISCLAIMER: This report does not constitute personal investment advice, nor does it take into account the individual financial circumstances or objectives of the clients who receive it. All information and research produced by Hantec Markets is intended to be general in nature; it does not constitute a recommendation or offer for the purchase or sale of any financial instrument, nor should it be construed as such.
All of the views or suggestions within this report are those solely and exclusively of the author, and accurately reflect his personal views about any and all of the subject instruments and are presented to the best of the author’s knowledge. Any person relying on this report to undertake trading does so entirely at his/her own risk and Hantec Markets does not accept any liability. """
