Oil traders are gearing up for one of the most closely watched OPEC+ meetings in recent history.
Oil has risen over 10% across the past two sessions as investors grow increasingly optimistic that the OPEC+ group can agree to cut between 10 million – 15 million barrels per day.
Reports on Thursday that Russia is prepared to cut 1.6 million barrels per day boosted optimism, sending WTI 5% higher to $27.46. However, reports that Saudi Arabia would want to cut from their April baseline, which is higher, making cuts more trivial, pulled oil off its high.
The OPEC+ meeting, via video conferencing today, is expected to be more successful than the group’s previous attempt in March. Last month’s the group’s failure to agree to extend supply cuts triggered a price war between Saudi Arabia and Russia.
$35 here we come?
There are still differences over plans to cut global output that Russia and Saudi Arabia need to resolve. However, we, like most traders expect a deal to be reached. This should set oil off on a short-term bullish move. The size of the rally will depend largely on whether the cuts are closer to 10 million barrels per day or 15 million.
Any rally will be capped below $35 because fundamentals remain weak. The bottom line is that the is too much oil whist demand has been crushed by coronavirus outbreak. Demand will start to ramp up but only once the lock down measures are eased. Signs of China starting to fire up again will offer support here.
Failure to agree
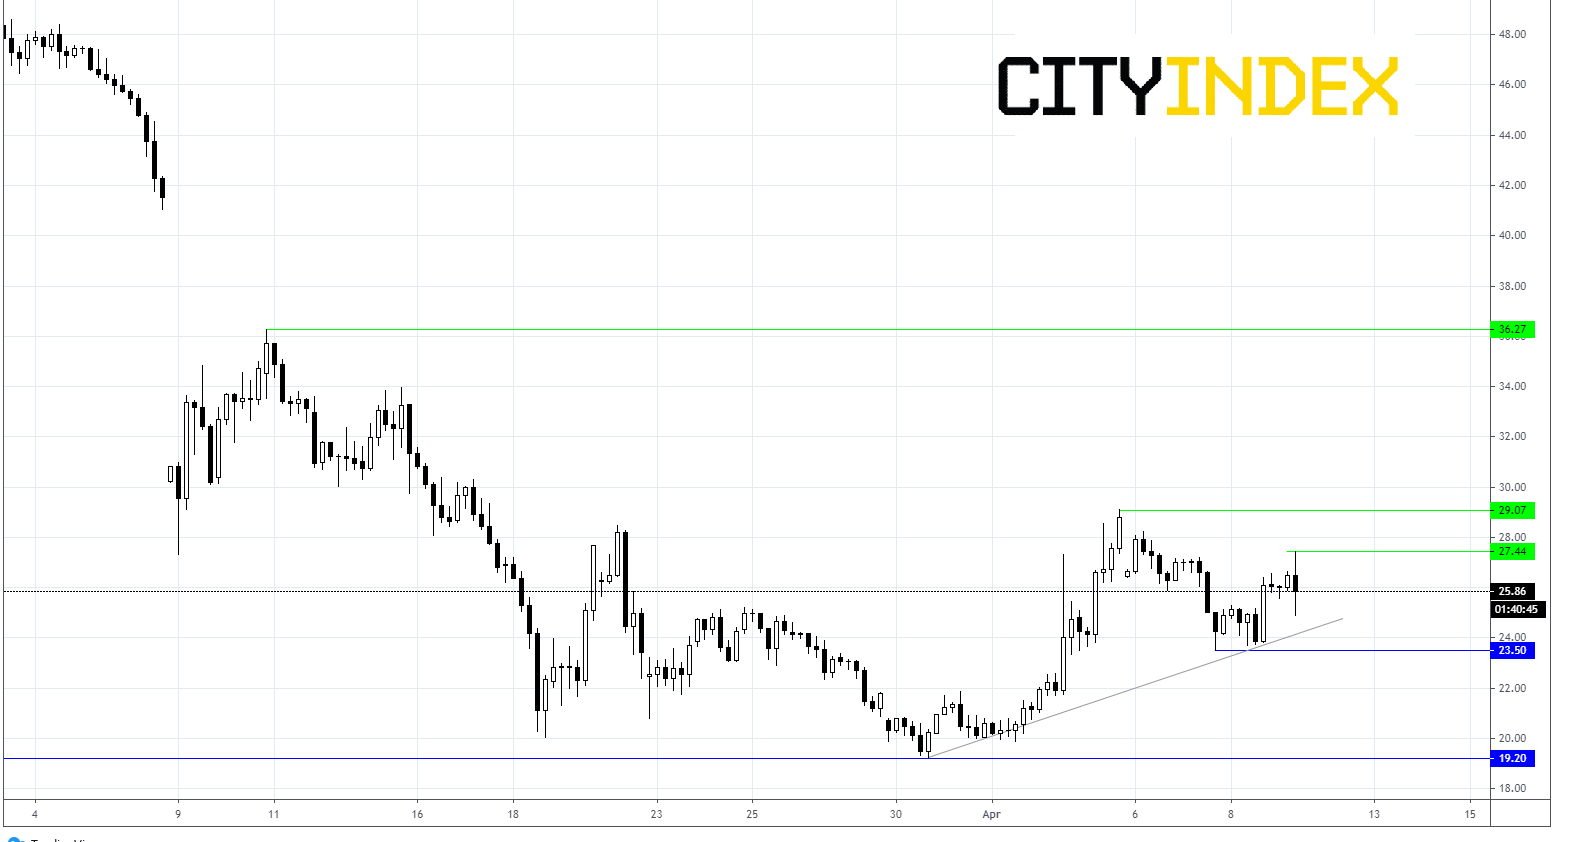
Should the OPEC+ group, or more specifically Russia and Saudi Arabia fail to iron out their differences, oil could rapidly give back the 10% gains achieved over the past 36 hours taking the price back towards support at $19.25
Levels to watch
WTI is trading 4% higher at $26.10, it has fallen back from the session high of $27.46 to $25.00 before rebounding again. Oil is trading comfortably above its ascending trendline from March 30th low.
Immediate resistance can be seen at $27.46, prior to $29.10 (high 3rd April) and $30.00 psychological number.
On the downside, support can be seen at $24.25 (trendline) prior to $23.50 (low 7th April)

"Disclaimer: The information and opinions in this report are for general information use only and are not intended as an offer or solicitation with respect to the purchase or sale of any currency or CFD contract. All opinions and information contained in this report are subject to change without notice. This report has been prepared without regard to the specific investment objectives, financial situation and needs of any particular recipient.
Any references to historical price movements or levels is informational based on our analysis and we do not represent or warrant that any such movements or levels are likely to reoccur in the future. While the information contained herein was obtained from sources believed to be reliable, the author does not guarantee its accuracy or completeness, nor does the author assume any liability for any direct, indirect or consequential loss that may result from the reliance by any person upon any such information or opinions."
