- Looks like oil bulls are back in charge, targeting $100 per barrell
- The energy sector is on the verge of rallying along with oil prices
- Chevron and ExxonMobil could lead the charge higher
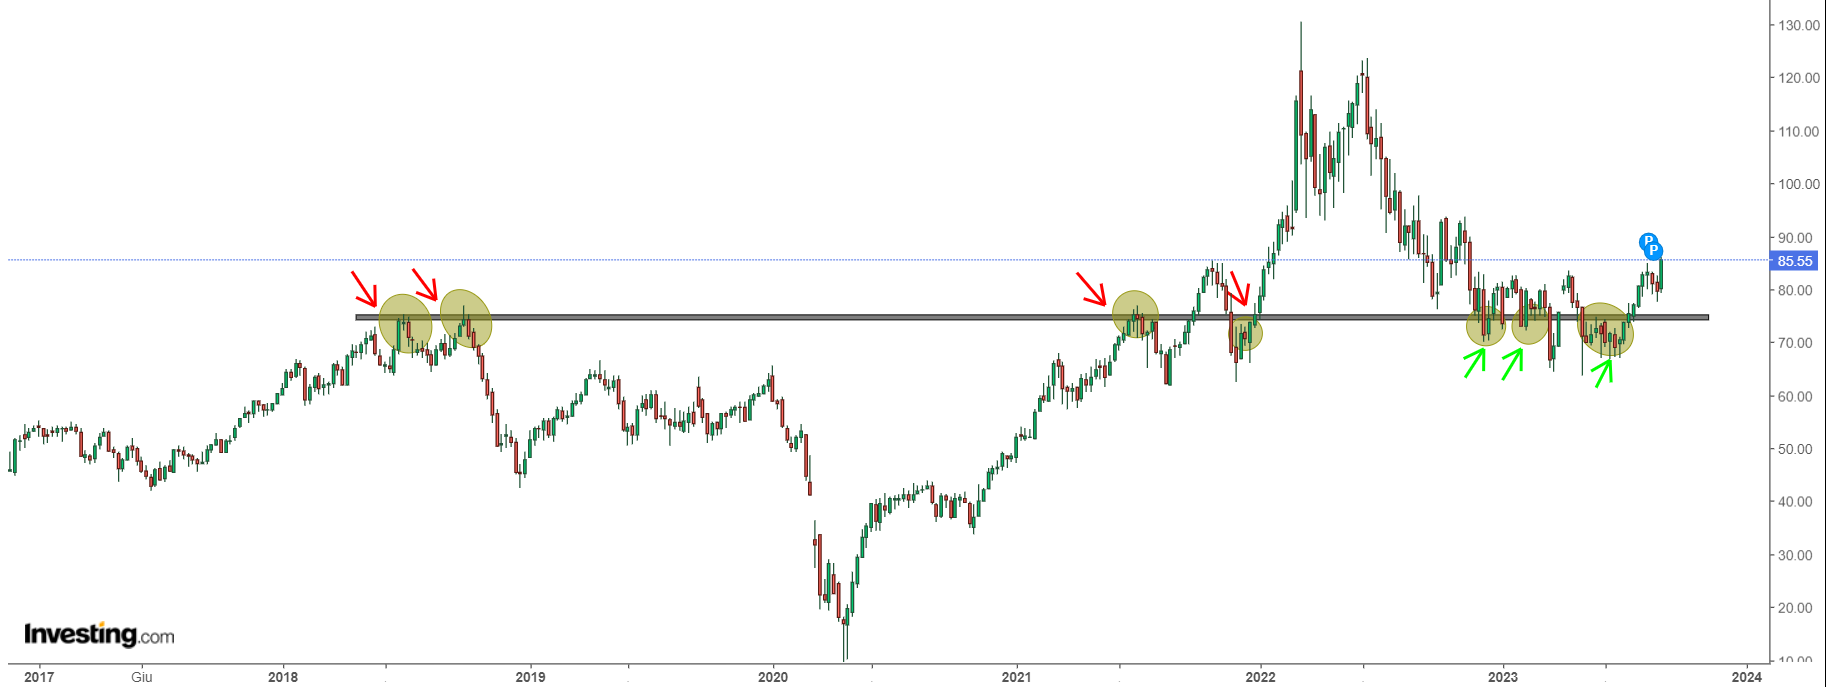
Oil prices have been on the rise, hitting their highest monthly close since October 2022.
What's worth noting is that the former resistance near $74, which had been in place since 2018, has now shifted to become a support level, indicating a strong bullish trend.

The real trend in energy stocks (NYSE:XLE) might just be getting started, as they've yet to make their significant move. Looking at the chart, they've recently crossed the psychological barrier set by the highs of 2008, with the highs from 2011 acting as a support level.

When we look at U.S. stocks of oil and other petroleum products, which are a highly visible part of the global market due to their weekly reporting, they've been on a decline, dropping by 34 million barrels since mid-July.
This downward trend has been observed in 5 out of the last 6 weeks. The decrease in U.S. inventories is seen as a sign that the global market itself is experiencing a deficit. Consequently, spot prices have been on the rise, along with the spread.
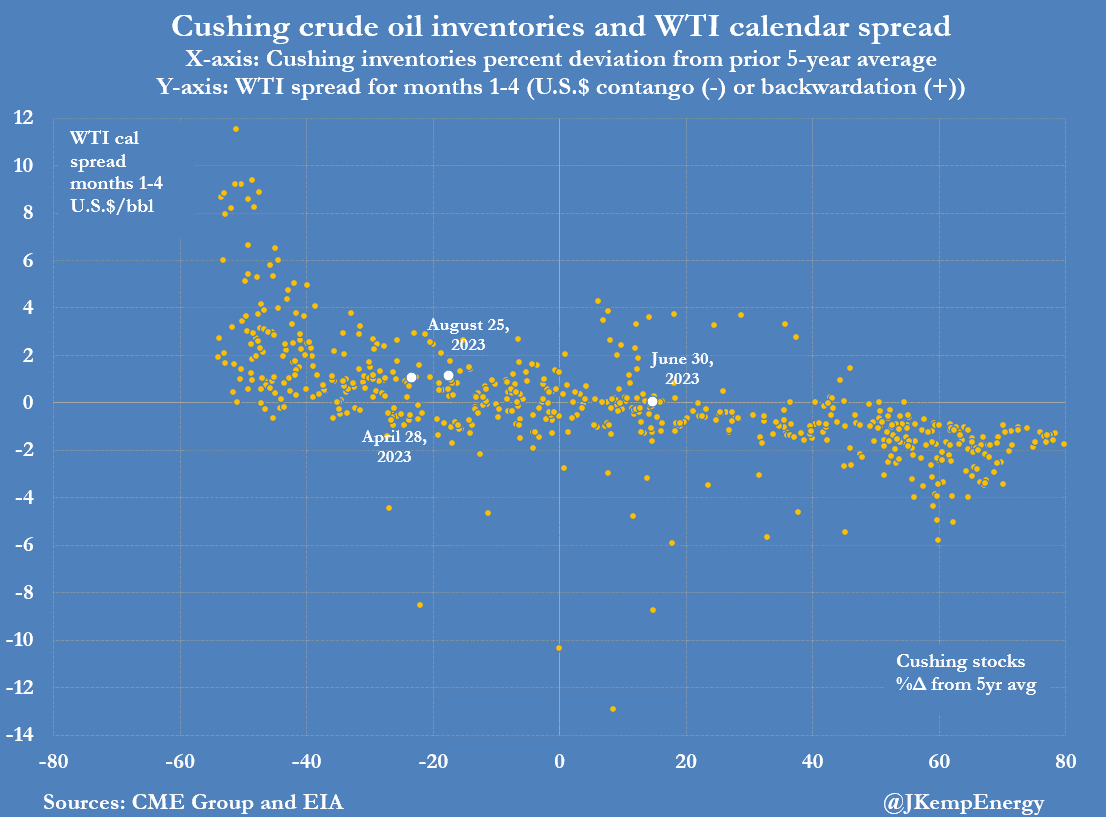
As of August 30, crude oil inventories were down by 10.514 million barrels. The data reported on June 28 this year showed a withdrawal of 9.603 million barrels. This has led to an increase in U.S. crude oil futures prices, particularly for monthly maturities.
The spread between 3-month crude oil futures has also entered a state known as 'backwardation,' meaning that the futures contract price is lower than the current spot price of the asset. This spread is currently at $1.14 per barrel compared to the situation in June.
Furthermore, in the first half of 2023, the US released approximately 26 million barrels of crude oil from the Strategic Petroleum Reserve. Since the beginning of 2022, around 247 million barrels have been released from this reserve.
Initially, this release contributed to pushing spot prices and spreads down. However, as the US moved to counter oil shortages caused by the Russian invasion of Ukraine, they began accumulating oil once again.
This reduction in the availability of crude oil in the global market subsequently drove prices higher.
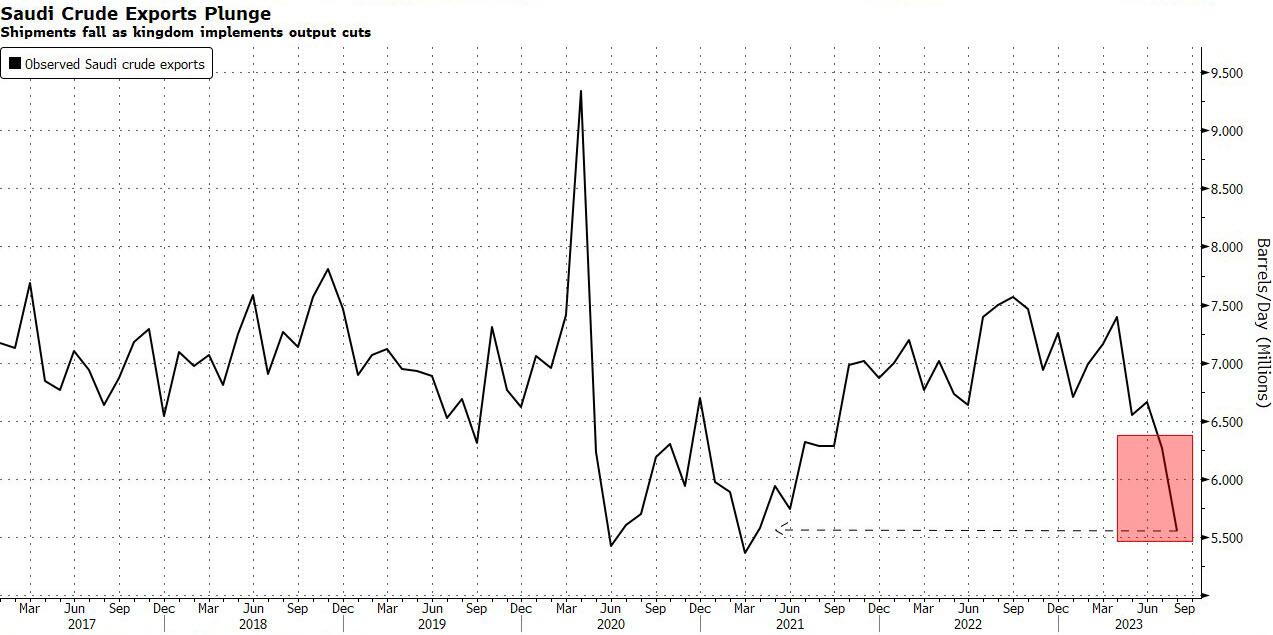
This trend coincided with additional production cuts by Saudi Arabia and Russia, which amounted to approximately 75 million barrels between July and August.
According to Bloomberg, Saudi Arabia's total exports in August reached about 5.6 million barrels per day, marking the lowest level observed since March 2021.

At the same time, Saudi Arabia is discreetly working to reduce global supply in an effort to push oil prices back up, potentially into triple digits.
Their strategy for September involves imposing significant price hikes on Europe and increasing the cost of supplies to Asia.
Additionally, the agreement between Russia and the other OPEC+ members should not be underestimated, as it aims to cut oil exports by 500,000 barrels per day.
ExxonMobil and Chevron Stocks to Continue Rising?
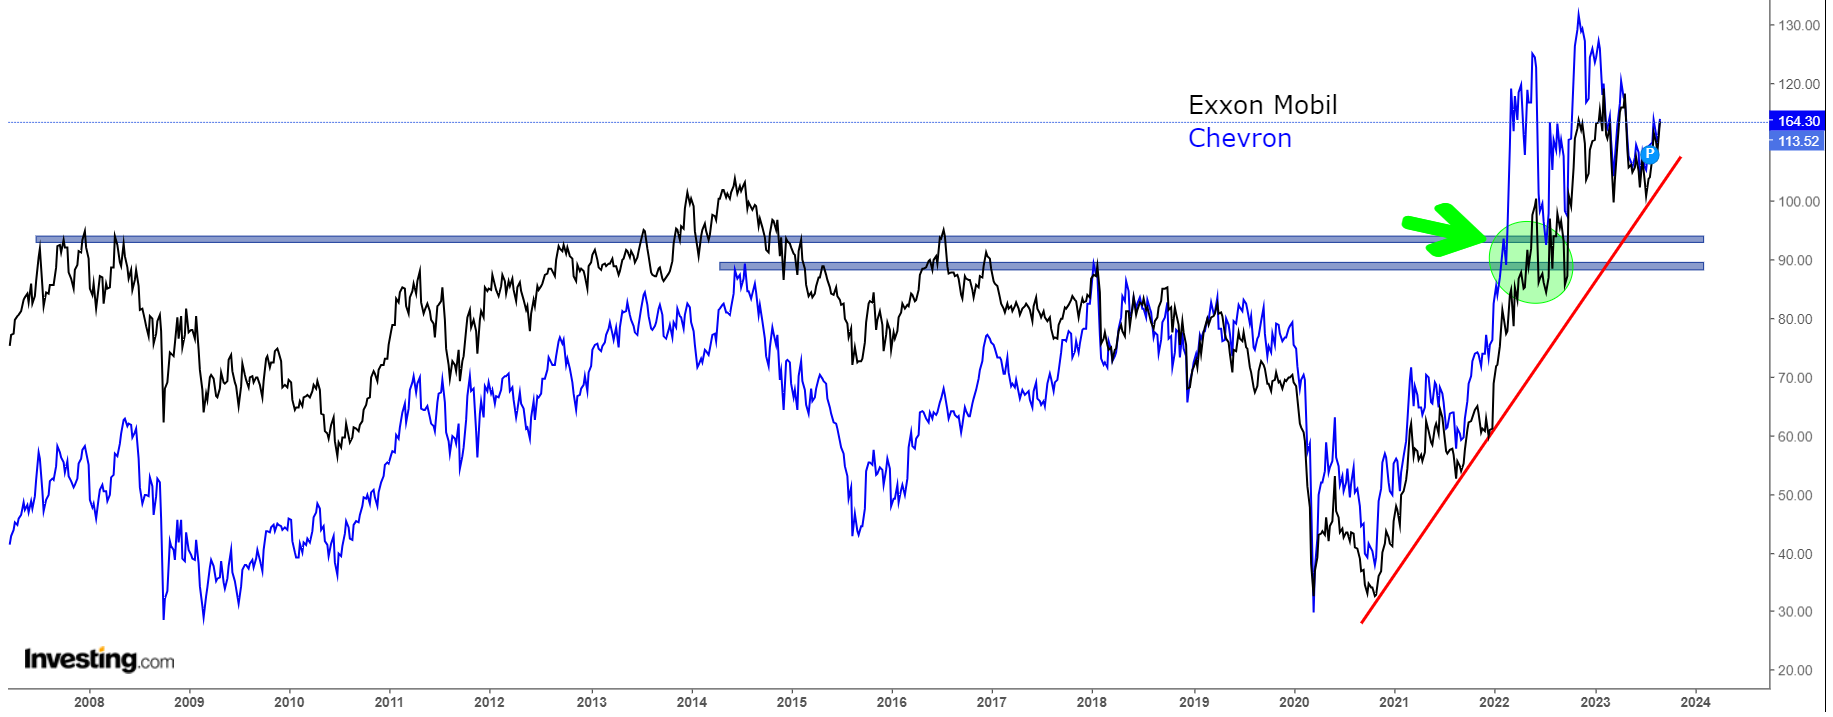
Meanwhile, stocks of ExxonMobil Corp (NYSE:XOM) and Chevron Corp (NYSE:CVX) have remained on an upward trajectory.

The energy sector is showing remarkable strength, with both stocks breaking through previous-year highs that had served as significant psychological resistance points. This suggests that if oil prices continue to climb, we could witness new all-time highs.
While analysts' average targets imply a slight decline in stock prices, indicating they are currently fairly valued, InvestingPro's Fair Value analysis paints a more optimistic picture. It suggests that both stocks have the potential for a 10 percent upside from their current levels.
In terms of financial health, the companies receive an average score of 4 out of 5, according to InvestingPro.
This underscores their positive financial situation, driven by healthy profit margins, strong earnings, high dividend quality, a balance sheet with more liquidity than debt, and free cash flow that surpasses net income.
Source: InvestingPro

Source: InvestingPro
Conclusion
The energy sector is showing notable strength, with Exxon Mobil and Chevron breaking through previous psychological resistance levels. This suggests the potential for new all-time highs if oil prices continue to rise.
Moreover, It's worth keeping an eye on Saudi Aramco (TADAWUL:2222)'s potential $50 billion stock sale, which is reportedly being considered for the end of this year.
While this isn't the first time the world's largest oil company has contemplated such a move, previous plans have been scaled back.
Back when Mohammed bin Salman pushed for Aramco's massive IPO, it ultimately didn't proceed on the NYSE due to concerns about transparency regarding production, exports, and reserves. Instead, it was listed on Tadawul in 2019.
The interesting question now is whether Aramco's renewed interest in a stock sale is influenced by more optimistic crude oil price projections.
The coming months will reveal Saudi Arabia's decisions regarding its relationships with BRICS nations and the potential geopolitical implications of such choices for the West.
***
Disclaimer: This article is written for informational purposes only; it does not constitute a solicitation, offer, advice, or recommendation to invest as such it is not intended to incentivize the purchase of assets in any way. I would like to remind you that any type of asset, is evaluated from multiple points of view and is highly risky and therefore, any investment decision and the associated risk remains with the investor.

