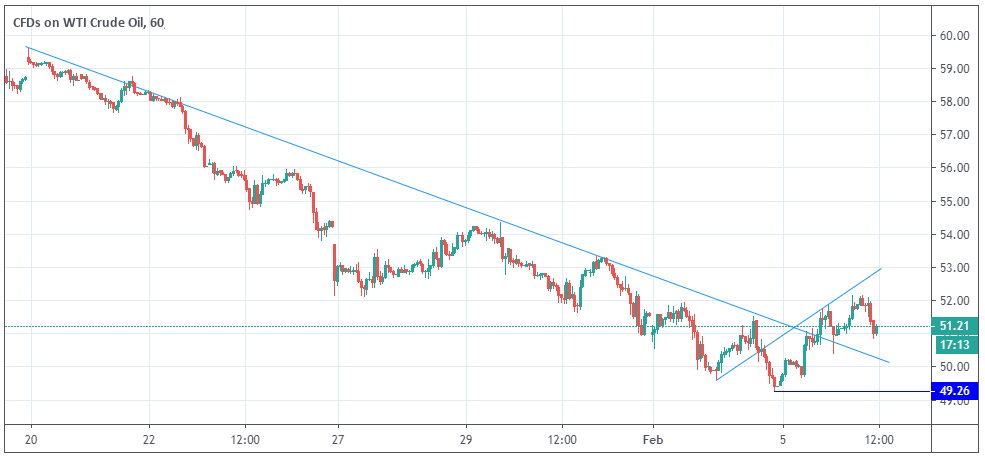
Oil is extending gains from the previous session on Thursday, adding 1% to Wednesday’s 2.5% lift. This is the first time in over two weeks that oil has advanced for two consecutive sessions.
Down 16% YTD
To say oil has had a bad start to the year would be an understatement. Despite the signing of the US -China first phase trade deal which was expected to boost future demand expectations, WTI has shed over 16% of its value year to date. However, these losses have come about over the past three weeks.
Coronavirus fears and its potential impact on Chinese economic growth has hit the price of oil hard. This is because slower growth in China, the second largest global consumer of oil would hit future demand significantly. Between January 20th – 4th February, the price of oil sunk over 17.5%, with just one day of gains across the period.
Coronavirus vaccine breakthrough & strong US data
Yesterday’s news of a coronavirus vaccine breakthrough was therefore well received by oil traders. Optimism that a cure to the lethal virus will be produced soon has helped abate fears over coronavirus and consequently future demand of oil.
Additionally, data from the US (the largest consumer of oil in the world) showing the US economy to be on a solid footing also supported the price of oil. ADP (NASDAQ:ADP) revealed a staggering 291,000 private jobs were created in January. ISM non-manufacturing index jumped to 55.5 last month the highest level since August.
Crude inventories
Not even higher than expected crude oil inventories were able to cap oil’s gains. The EIA reported a surplus of 3.4 million barrels last week, ahead of the 2.9 million expected.
Levels to watch
Oil has moved above the its falling trend line on the 1 hour chart. After rebounding off yesterday’s low $49.25, oil has made series of higher highs and higher lows.
Immediate resistance can be seen around $52.16 (today’s high). A close above this level could see oil push towards ascending trend line resistance at $53.
On the downside, a move below support from the descending trend line around $50.20 could indicate the bears are in control and look to test $49.25.

Crude Oil WTI
"Disclaimer: The information and opinions in this report are for general information use only and are not intended as an offer or solicitation with respect to the purchase or sale of any currency or CFD contract. All opinions and information contained in this report are subject to change without notice. This report has been prepared without regard to the specific investment objectives, financial situation and needs of any particular recipient.
Any references to historical price movements or levels is informational based on our analysis and we do not represent or warrant that any such movements or levels are likely to reoccur in the future. While the information contained herein was obtained from sources believed to be reliable, the author does not guarantee its accuracy or completeness, nor does the author assume any liability for any direct, indirect or consequential loss that may result from the reliance by any person upon any such information or opinions."
