European VC an attractive way to gain tech exposure
Despite the recent weakness in deal activity, we consider European venture capital (VC) as a compelling route to gain exposure to the European tech sector, especially given the limited options in European public markets, the fact that companies are staying private for longer, as well as superior historical VC returns versus public markets. Furthermore, we note several government initiatives across Europe aimed at supporting the development of an innovative tech ecosystem, such as the UK’s Science and Technology Framework (launched in March 2023), the Mansion House reforms (unveiled in July 2023) and Germany’s €1bn VC start-up growth fund of funds, launched in November 2023, with the federal government and development bank KfW as anchor investors.
Why consider Molten Ventures now?
As a well-established listed VC player in Europe, Molten provides exposure to a diverse portfolio of private high-growth technology companies across enterprise software, hardware and deeptech, as well as digital health and wellness, which are otherwise hard to access. The completion of the Forward Partners (FP) acquisition (discussed in our previous note) expands its portfolio into further tech subsectors. Molten’s liquid resources (cash and undrawn credit facility) of £117m at end-March 2024 provide good balance sheet headroom for new and follow-on investments. We also note that Molten Ventures (LON:GROW) was recently added to the UK flagship mid-cap index. Molten’s shares now trade at a discount of c 41% to the end-FY24 NAV of 662p per share. NOT INTENDED FOR PERSONS IN THE EEA
Tentative signs of stabilisation in valuations in H224
In line with the developments covered in our May update note (published following Molten’s full-year trading update), fair values across the company’s portfolio remained broadly stable in FY24 (1% reduction, or a slight 0.4% uplift excluding FX), assisted by the positive developments in H224 that saw a £56m net fair value increase excluding FX (which offset the H124 decline). We note that the H224 performance includes a £38.6m gain on a bargain purchase, which Molten recognised on the acquisition of FP (based on FP’s share price discount to NAV at which the all-share deal was completed), as well as a fair value uplift related to the secondary investment in the Seedcamp Fund III completed in February 2024 (see our May update note for details). We calculate that excluding the gain on the FP bargain purchase, Molten’s net negative fair value change in FY24 stood at c £34m, or 2.5% of the opening gross portfolio value (including a c 1.3% rebound in H224), which still suggests a degree of stabilisation in portfolio valuations.
Molten’s NAV per share fell by c 15% in FY24, mostly due to the dilutive impact of the recent capital raise and the all-share FP deal, the above-mentioned limited decline in portfolio value, as well as FX headwinds of £24m (or 1.7% of opening gross portfolio value). For details on discrete NAV TR performance for previous financial years, please see our May update note.
Two exits agreed at a modest uplift to last carrying value
We believe the diminishing valuation headwinds are also illustrated by the fact that the recently announced realisations of Endomag and Perkbox were agreed at a modest uplift to their last carrying values at end-March 2024, which implied multiples on invested capital of c 3.7x (quite a healthy return since the initial investment in 2018) and c 1.2x (a rather moderate but still positive return), respectively. Endomag is being acquired by the Nasdaq-listed Hologic, as per the definitive agreement announced on 29 April 2024. Molten will exit Perkbox following the latter’s combination with Vivup, a provider of health and well-being benefits, through a strategic majority investment from private equity firm Great Hill Partners.
Share of rounds at lower valuations up only slightly in Q124
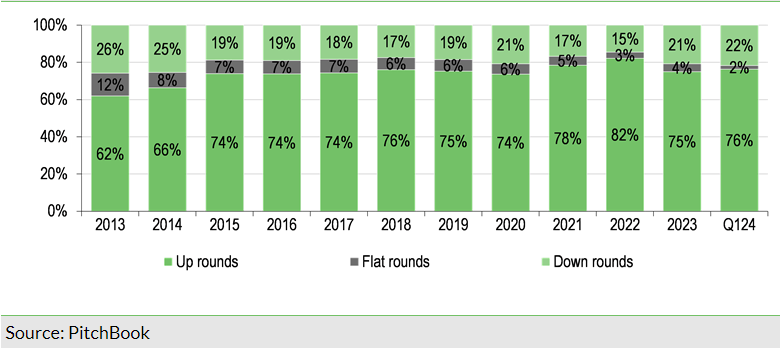
The proportion of down rounds across the broader European VC market stood at 21.7% in Q124, only a slight increase from 20.8% in 2023 (vs 14.5% in 2022), according to PitchBook (see Exhibit 1). Further valuation headwinds cannot be ruled out, given that many VC-backed companies delayed new funding rounds in recent months by reducing their cash burn rates. Still, it seems that the European VC valuation environment is gradually stabilising, with median deal sizes increasing across all stages in Q124. Moreover, the recent onset of the rate cut cycle of the European Central Bank (with a 25bp reduction of the main interest rate in June) may prove supportive to private company valuations. That said, we note that the US Fed chair recently communicated a more hawkish stance, signalling only one rate cut until the end of 2024.
Deal activity gradually picking up as well
There are some tentative signs of a revival in the broader IPO and private M&A markets. Reuters recently indicated, citing Dealogic data, that Q124 global M&A volumes increased by 30% y-o-y to US$755.1m, mostly on the back of a pick-up in mega-cap deals. European VC deal value increased by 19% y-o-y to €16.3bn in Q124 (though deal count was down c 46% y-o-y, based on PitchBook data as at end-March 2024), assisted by the €4.75bn megadeal of the cleantech business H2 Green Steel in January 2024. The Q124 figure is still 54% lower than the Q122 level; hence, activity remains modest for the time being. That said, fund-raising volumes in recent years, coupled with cautious capital deployment in 2023, have left VC funds with a significant amount of dry powder, which may support deal activity throughout 2024. Despite this, European VC fund-raising was quite resilient in Q124, at €4.6bn (across more than 47 vehicles), compared to full-year figures of €19.0bn in 2023 and €30.6bn in 2022, according to PitchBook. Meanwhile, European VC exits remained subdued in Q124, at €1.9bn (lower than the €3.4bn in Q123 and well below the €14.6bn in Q122), based on PitchBook data.
Solid top-line momentum and cash runway of core holdings maintained
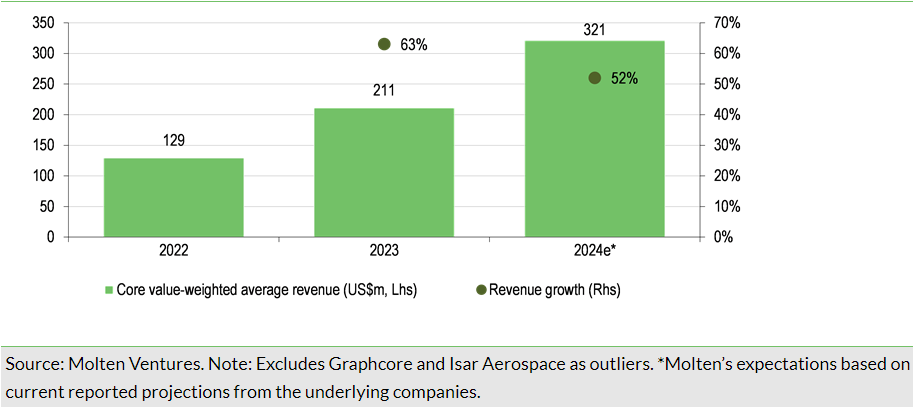
The valuation markdowns in FY24 were primarily related to holdings outside of Molten’s end-March 2024 core holdings, which saw a minor £3.4m net negative fair value movement in FY24. Molten’s 20 core portfolio holdings (which made up c 62% of end-March 2024 gross portfolio value) sustained strong top-line growth, with value-weighted average revenues growing by 63% in 2023 to £211m, and Molten’s management expects 2024 growth to reach 52% (based on current reported projections; see chart on front page). The above figures exclude Graphcore and Isar Aerospace as outliers (which together made up c 5% of Molten’s core portfolio value at end-March 2024).
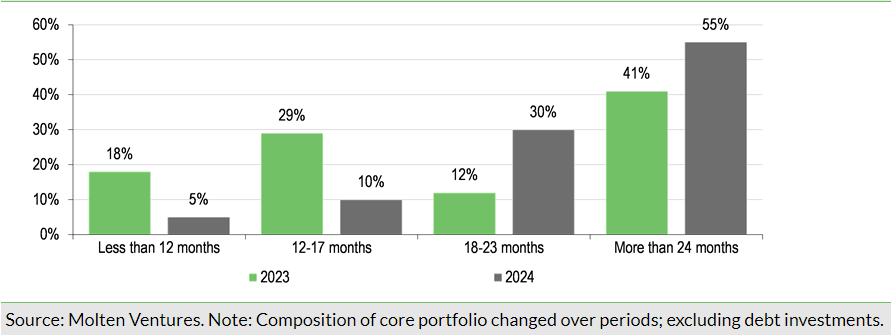
Moreover, Molten’s core portfolio remains well funded, with 95% of its holdings by value having a cash runway of more than 12 months, including 55% with a cash runway of more than 24 months (see Exhibit 2). Molten’s management highlighted that its core portfolio companies raised in aggregate over £1.2bn in FY23 and FY24, with 90% of the capital raised at valuations in line with or above previous funding rounds.
Most of portfolio valued using a revenue multiple
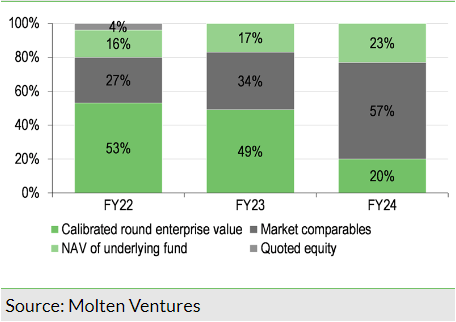
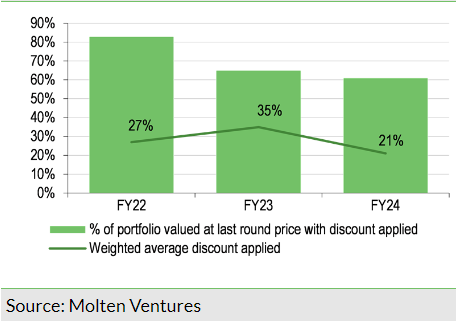
The above-mentioned good top-line momentum had a direct impact on Molten’s fair values, as 57% of its portfolio at end-March 2024 (34% at end-March 2023) was valued based on market comparables (see Exhibit 3), primarily revenue multiples of listed peers or relevant private market transactions (with a weighted average multiple of 6.6x at end-March 2024 vs 7.5x at end-March 2023). We understand that the significant increase in the proportion of holdings valued using revenue multiples reflects a less active fund-raising environment (therefore making public multiples a better comparator than last founding round valuation). Around 20% of Molten’s portfolio at end-March 2024 (49% at end-March 2023) was valued using the last funding round, which is calibrated to account for movements in the revenue multiples of public peers since the deal closure, as well as any subsequent technical/product milestones and the trading performance of the company compared to expectations at the time of the funding round. As regards this valuation technique, Molten’s aim is to reflect the current revenue trajectory in its carrying values (rather than the full prospective growth path, which normally determines valuations of funding rounds), as it prefers to gradually recognise the ‘success story’ of its portfolio winners. As a result, it applied a weighted average discount of 21% to 61% of its holdings valued based on the calibrated last funding round (see Exhibit 4). This compares with 35% and 65%, respectively, at end-March 2023, with the narrowing of the discount reflecting the revenue growth of the companies (which assisted the closing of the valuation gap to last funding round) and improving public comparable multiples. The remaining 23% of Molten’s portfolio represent investments as a limited partner in seed fund of funds, valued at NAV of the underlying fund.
Strengthened balance sheet
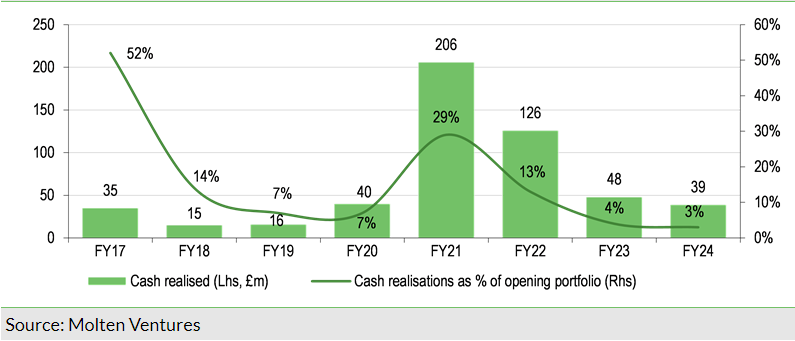
Molten invested £65m (including £25m in the FP deal) while collecting £39m in realisation proceeds in FY24 (see our previous note for details) at a fair value uplift of £6m excluding FX. The company’s liquidity at end-March 2024 consisted of a £57m cash balance and £60m of an undrawn revolving credit facility (RCF, available until September 2024), which together represented 9.4% of net assets. Alongside the RCF, Molten has a £90m drawn debt facility, which is subject to certain covenants as outlined in the company’s annual report.
Molten’s management highlighted that there are multiple realisation processes either underway or planned across the company’s portfolio and it therefore expects FY25 realisations of around £100m (or c 7.3% of opening gross portfolio value), which is closer to the company’s FY17–24 average of around 10% (see Exhibit 5).
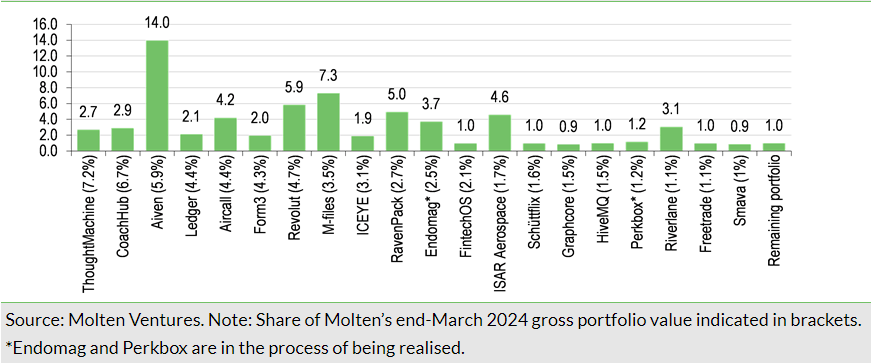
We note that roughly half of the guided FY25 exits are already covered by the announced realisations of Endomag and Perkbox, which at end-March 2024 were valued at £34.7m and £16.7m, respectively. While management did not disclose any further details with respect to potential exits, we note that some of Molten’s core holdings are held at a multiple of cost, which potentially makes them ripe for an exit from a return perspective (see Exhibit 6).
Updated capital allocation policy revealed
Following Molten’s equity raise last year, and with an improving exit outlook, Molten has updated its capital allocation policy. The company maintains its focus on deploying capital into attractively priced investment opportunities across primary and secondary deals, with a particular emphasis on the latter. Molten’s management indicated that it expects a window of opportunity for attractively priced secondary deals of 12–18 months. Furthermore, Molten earmarked a minimum of 10% of future realisation proceeds for share buybacks under the existing authority granted to the board by the AGM. In this context, we note that Molten’s current discount to NAV, while still wide at c 41%, is narrower than the 62% at the time of the last equity raise.
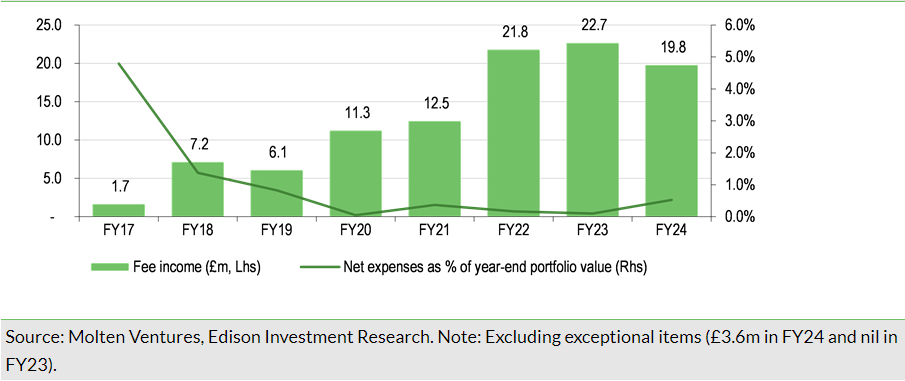
The company aims to maintain a liquidity reserve equal to 18 months of rolling operating expenses net of fee income. Molten’s operating expenses remain comfortably within its target of less than 1%, standing at 0.5% in FY24 net of fee income and excluding exceptional items (or 0.1% if non-cash expenses are excluded as well), see Exhibit 7. This was supported by £20m of fee income on the assets it manages (including the £400m of third-party assets across EIS and VCT strategies), slightly down from £23m in FY23 due to performance fee hurdle requirements. We note that Molten recently launched a €50m Irish-focused fund with Ireland Strategic Investment Fund.
General disclaimer and copyright
This report has been commissioned by Molten Ventures and prepared and issued by Edison, in consideration of a fee payable by Molten Ventures. Edison Investment Research standard fees are £60,000 pa for the production and broad dissemination of a detailed note (Outlook) following by regular (typically quarterly) update notes. Fees are paid upfront in cash without recourse. Edison may seek additional fees for the provision of roadshows and related IR services for the client but does not get remunerated for any investment banking services. We never take payment in stock, options or warrants for any of our services.
Accuracy of content: All information used in the publication of this report has been compiled from publicly available sources that are believed to be reliable, however we do not guarantee the accuracy or completeness of this report and have not sought for this information to be independently verified. Opinions contained in this report represent those of the research department of Edison at the time of publication. Forward-looking information or statements in this report contain information that is based on assumptions, forecasts of future results, estimates of amounts not yet determinable, and therefore involve known and unknown risks, uncertainties and other factors which may cause the actual results, performance or achievements of their subject matter to be materially different from current expectations.
Exclusion of Liability: To the fullest extent allowed by law, Edison shall not be liable for any direct, indirect or consequential losses, loss of profits, damages, costs or expenses incurred or suffered by you arising out or in connection with the access to, use of or reliance on any information contained on this note.
No personalised advice: The information that we provide should not be construed in any manner whatsoever as, personalised advice. Also, the information provided by us should not be construed by any subscriber or prospective subscriber as Edison’s solicitation to effect, or attempt to effect, any transaction in a security. The securities described in the report may not be eligible for sale in all jurisdictions or to certain categories of investors.
Investment in securities mentioned: Edison has a restrictive policy relating to personal dealing and conflicts of interest. Edison Group does not conduct any investment business and, accordingly, does not itself hold any positions in the securities mentioned in this report. However, the respective directors, officers, employees and contractors of Edison may have a position in any or related securities mentioned in this report, subject to Edison's policies on personal dealing and conflicts of interest.
Copyright: Copyright 2024 Edison Investment Research Limited (Edison).
Australia
Edison Investment Research Pty Ltd (Edison AU) is the Australian subsidiary of Edison. Edison AU is a Corporate Authorised Representative (1252501) of Crown Wealth Group Pty Ltd who holds an Australian Financial Services Licence (Number: 494274). This research is issued in Australia by Edison AU and any access to it, is intended only for "wholesale clients" within the meaning of the Corporations Act 2001 of Australia. Any advice given by Edison AU is general advice only and does not take into account your personal circumstances, needs or objectives. You should, before acting on this advice, consider the appropriateness of the advice, having regard to your objectives, financial situation and needs. If our advice relates to the acquisition, or possible acquisition, of a particular financial product you should read any relevant Product Disclosure Statement or like instrument.
New Zealand
The research in this document is intended for New Zealand resident professional financial advisers or brokers (for use in their roles as financial advisers or brokers) and habitual investors who are “wholesale clients” for the purpose of the Financial Advisers Act 2008 (FAA) (as described in sections 5(c) (1)(a), (b) and (c) of the FAA). This is not a solicitation or inducement to buy, sell, subscribe, or underwrite any securities mentioned or in the topic of this document. For the purpose of the FAA, the content of this report is of a general nature, is intended as a source of general information only and is not intended to constitute a recommendation or opinion in relation to acquiring or disposing (including refraining from acquiring or disposing) of securities. The distribution of this document is not a “personalised service” and, to the extent that it contains any financial advice, is intended only as a “class service” provided by Edison within the meaning of the FAA (i.e. without taking into account the particular financial situation or goals of any person). As such, it should not be relied upon in making an investment decision.
United Kingdom
This document is prepared and provided by Edison for information purposes only and should not be construed as an offer or solicitation for investment in any securities mentioned or in the topic of this document. A marketing communication under FCA Rules, this document has not been prepared in accordance with the legal requirements designed to promote the independence of investment research and is not subject to any prohibition on dealing ahead of the dissemination of investment research.
This Communication is being distributed in the United Kingdom and is directed only at (i) persons having professional experience in matters relating to investments, i.e. investment professionals within the meaning of Article 19(5) of the Financial Services and Markets Act 2000 (Financial Promotion) Order 2005, as amended (the "FPO") (ii) high net-worth companies, unincorporated associations or other bodies within the meaning of Article 49 of the FPO and (iii) persons to whom it is otherwise lawful to distribute it. The investment or investment activity to which this document relates is available only to such persons. It is not intended that this document be distributed or passed on, directly or indirectly, to any other class of persons and in any event and under no circumstances should persons of any other description rely on or act upon the contents of this document.
This Communication is being supplied to you solely for your information and may not be reproduced by, further distributed to or published in whole or in part by, any other person.
United States
Edison relies upon the "publishers' exclusion" from the definition of investment adviser under Section 202(a)(11) of the Investment Advisers Act of 1940 and corresponding state securities laws. This report is a bona fide publication of general and regular circulation offering impersonal investment-related advice, not tailored to a specific investment portfolio or the needs of current and/or prospective subscribers. As such, Edison does not offer or provide personal advice and the research provided is for informational purposes only. No mention of a particular security in this report constitutes a recommendation to buy, sell or hold that or any security, or that any particular security, portfolio of securities, transaction or investment strategy is suitable for any specific person.
London │ New York │ Frankfurt
20 Red Lion Street
London, WC1R 4PS
United Kingdom
