Market Overview
Today’s Trump update on the trade dispute is positive. Apparently, the talks are “moving right along” and again sentiment is edging more positive. However, trading the headlines makes for a skittish market, and a lack of conviction is clear across majors. After claiming earlier this week that a deal may not be seen in front of the 2020 presidential election, who knows what Trump may say next week. It is an emotionally exhausting path to try and navigate, but as we move closer to the 15th December deadline for the next round of US tariffs on Chinese goods, we will begin to see the picture a little more clearly (we can only hope). Accordingly, there is a positive edge that is weighing on assets at the safer end of the risk spectrum.
Bond yields are higher, and equities are rebounding, whilst on the other hand, the Aussie and Kiwi are performing well in the forex space. It is interesting to see that as US data continues to underwhelm, the dollar is also being pressured. It brings focus to today’s Non-farm Payrolls data, which if also disappoints then could really begin to drag on the dollar into the Fed meeting next week. After Wednesday ADP (NASDAQ:ADP) jobs numbers disappointed, the bar is fairly low for payrolls. Could the volatility come out of a strong report then?
Wall Street closed last night with marginal gains, with the S&P 500 +0.2% at 3117. US futures have continued to tick slightly higher today, currently, +0.2% and this has helped Asian markets to edge higher (Nikkei +0.2%, Shanghai Composite +0.4%). There are also slight early gains in Europe with the FTSE futures +0.2% and DAX futures +0.3%.
In forex, there is a slight risk positive tilt to moves, but the main underperformer is USD, whilst NZD continues to outperform.
In commodities, the risk positive move is a drag on gold which is -$2 whilst oil is tentatively lower by -0.2% ahead of the OPEC+ meeting today.
The primary focus on the economic calendar will undoubtedly be the US jobs report, however, it would also be best not to miss the Michigan Sentiment either. The US Employment Situation is at 13:30 GMT with headline Nonfarm Payrolls expected to increase to 180,000 in November (from 128,000 in October). Having seen a sizable revision of jobs last month, this could again play a key role in determining the overall makeup of the report. We also have Average Hourly Earnings which at expected to grow by +0.3% on the month which would keep the year on year again at +3.0% (+3.0% for October). US Unemployment remains on its downward trend but has been settling in recent months and is again expected to be at 3.6% (3.6% in October). The U6 Underemployment ticked slightly higher to 7.0% in October and should also be watched. As should the laborforce Participation Rate which continued its increase in October as it posted 63.3% which was the highest for more than six years.
Aside from the payrolls report, the key data is the Michigan Sentiment for December at 1500GMT and is expected to improve across the board. The headline Sentiment gauge is forecast to pick up slightly to 97.0 (from the final reading of 96.8 in November). This comes with improvement in the Michigan Current Conditions component to 112.4 (from a final reading of 111.6 in November) whilst the Michigan Expectations component is expected to improve to 88.0 (from 87.3 in November).
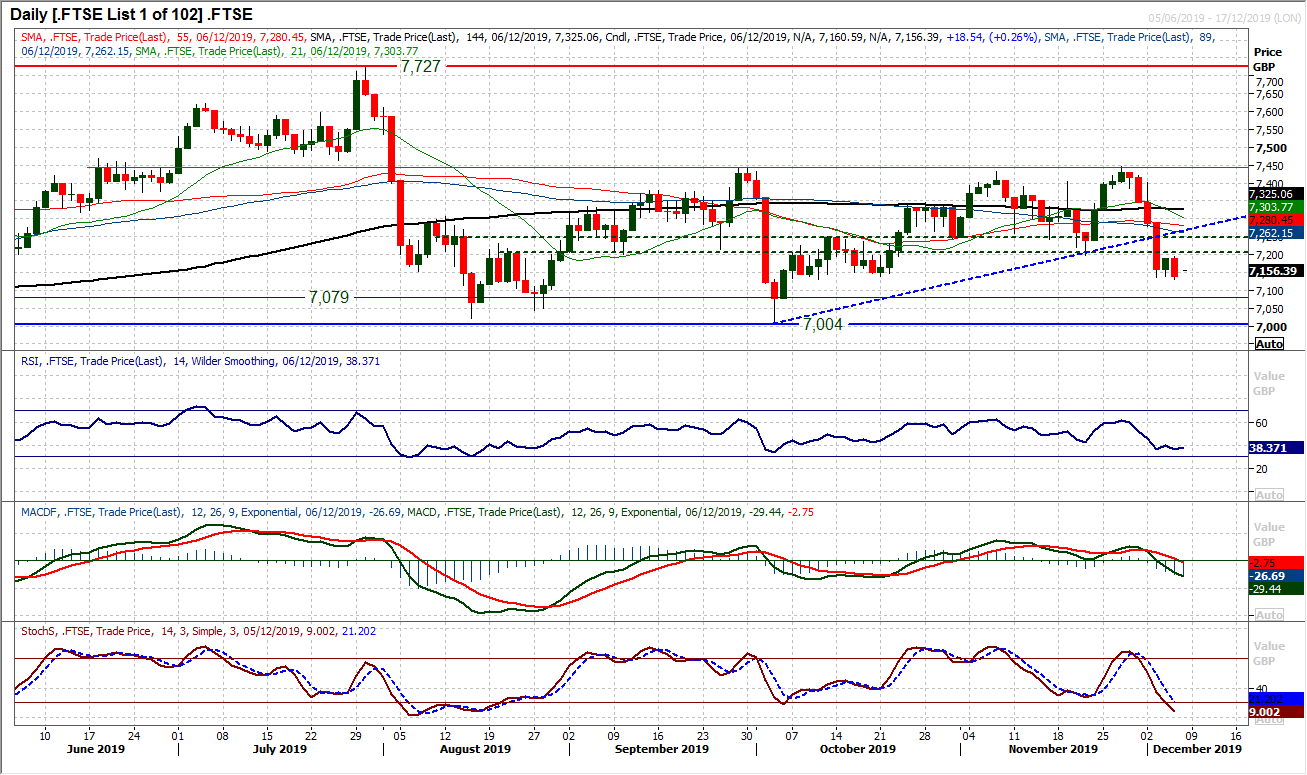
Chart of the Day – FTSE 100
There is still a negative correlation to consider when trading FTSE 100. As GBP rallies (as it has done again recently) this acts as a drag on the performance of FTSE 100. The breakout on GBP has coincided with weakness in equities recently and this has subsequently hit FTSE 100 relatively hard. The result has been a breach of a nine week recovery uptrend, with the formation of a new negative trend. A break below support at 7197 (the old November low) came earlier this week. However, the market has subsequently failed as this has become resistance. This move has come with the RSI falling below 40 in a move, whilst the MACD and Stochastics lines are turning negative. Yesterday’s solid bear candle closing around the low of the day is now eyeing the support around 7130/7140 which is the final real support until the 7004 October low. Yesterday’s price action also shows that rallies are now a chance to sell. There is resistance in the band around 7200/7245. If GBP remains strong and risk appetite mixed, a drop back on FTSE towards 7000 cannot be ruled out.
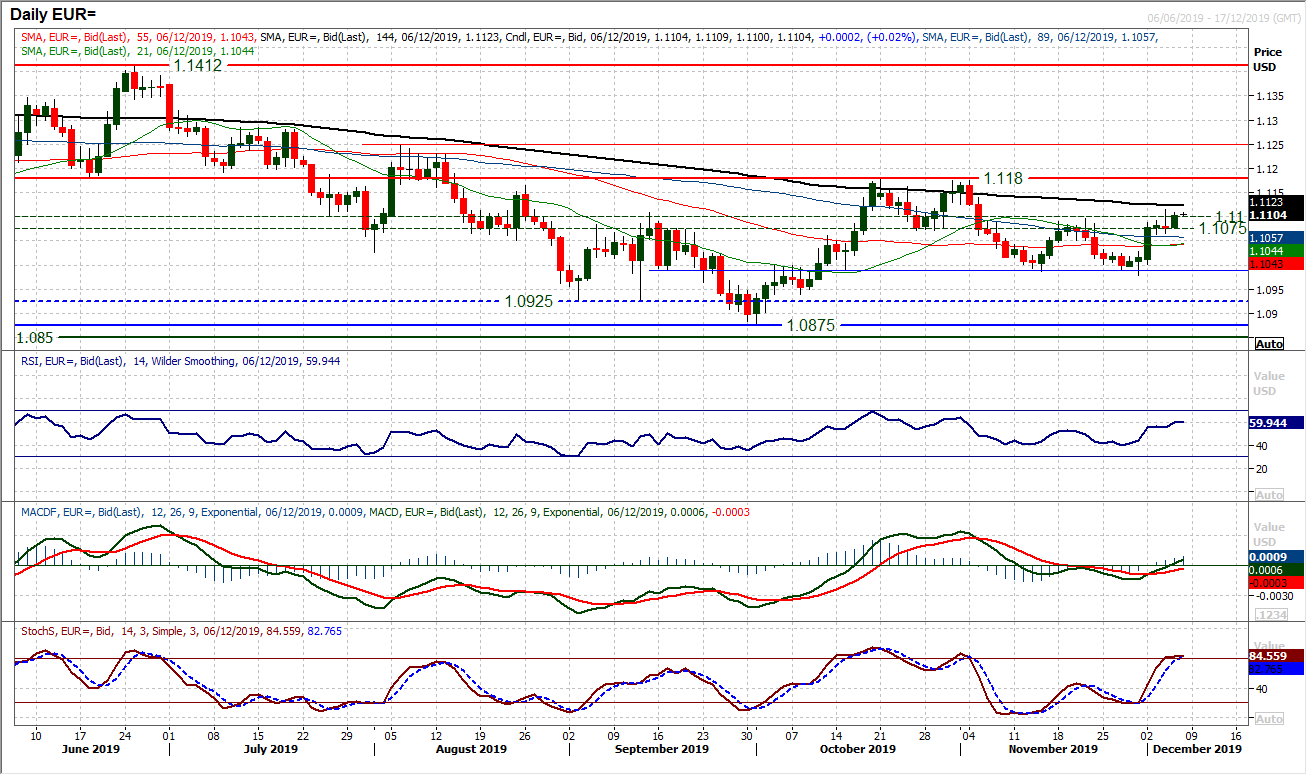
A decently solid positive candle has pulled EUR/USD up to around the $1.1100 resistance once more. After a few days of indecision, the bulls are looking a little better positioned around here now as the dollar seems to be under mounting pressure. The payrolls report today will be the main factor for today’s session and is likely to lend direction on a near term basis, but the trade dispute remains key. On a technical basis, a close decisively clear above $1.1100 opens what is still a medium term consolidation range high of $1.1180. The improved RSI moving into the 60s would also confirm a growing positive outlook within this range. The hourly chart is taking on a more positive configuration on momentum now, with weakness on the hourly RSI into 40/50 in the past week seen as a chance to buy. Initial support is at $1.1065.
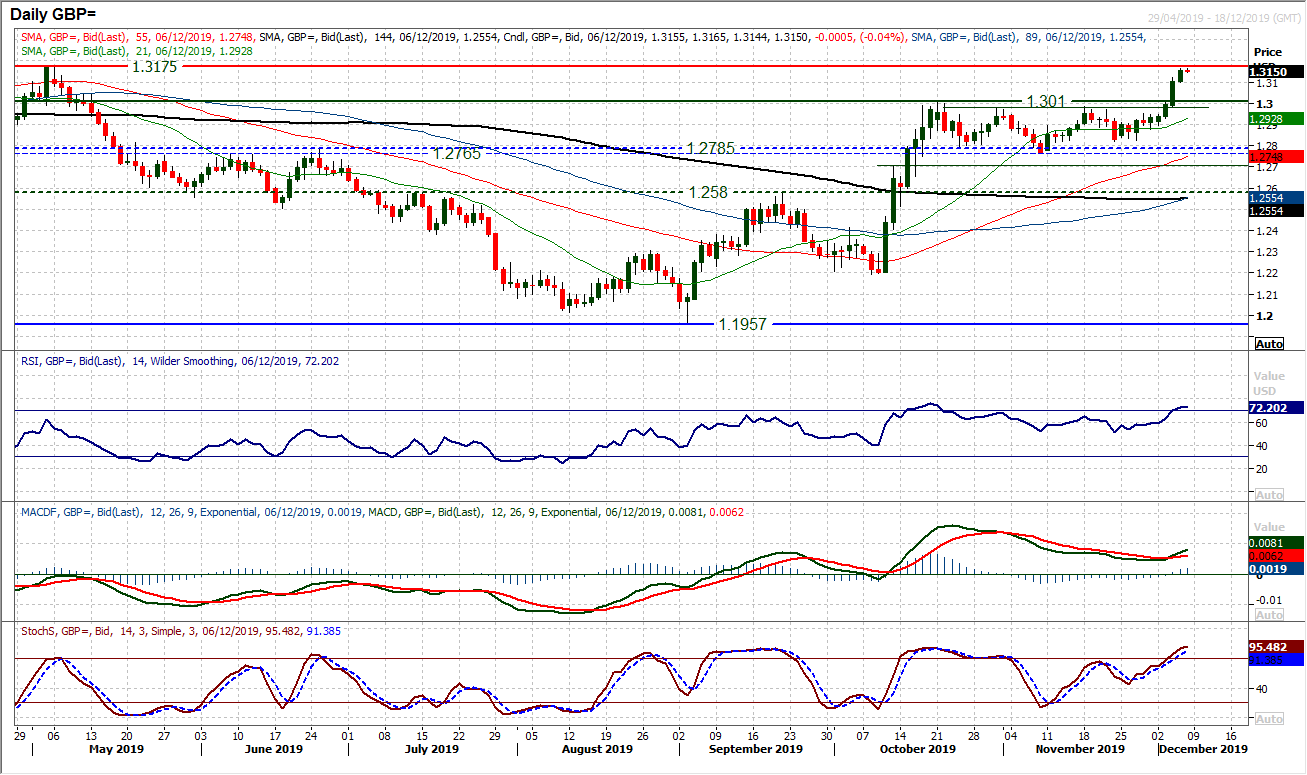
In one week from now, we will know the UK election result. Sterling traders are already taking a view. The decisive breakout above $1.3000 has been taken on a view that the opinion polls are wide enough in the favour of the Conservatives that the result is a given. Whilst we see this as premature (and believe that the result will be closer than the polls suggest), Cable is running decisively higher. Momentum is strong with the run of bull candles in the past few sessions. Resistance at $1.3175 is being tested and a breakout would then open $1.3383 which was the key March 2019 high. We see this as a target and beyond if there were to be a sizable Conservative majority announced next Friday. Momentum is strong with RSI into the 70s, Stochastics into the 80s and MACD lines now finally bull crossing higher. However, caution is needed as the polls could easily tighten in the final week. If so, it would certainly take the steam out of the run higher and run the risk of a correction back towards $1.2975/$1.3010 which is now key supportive.
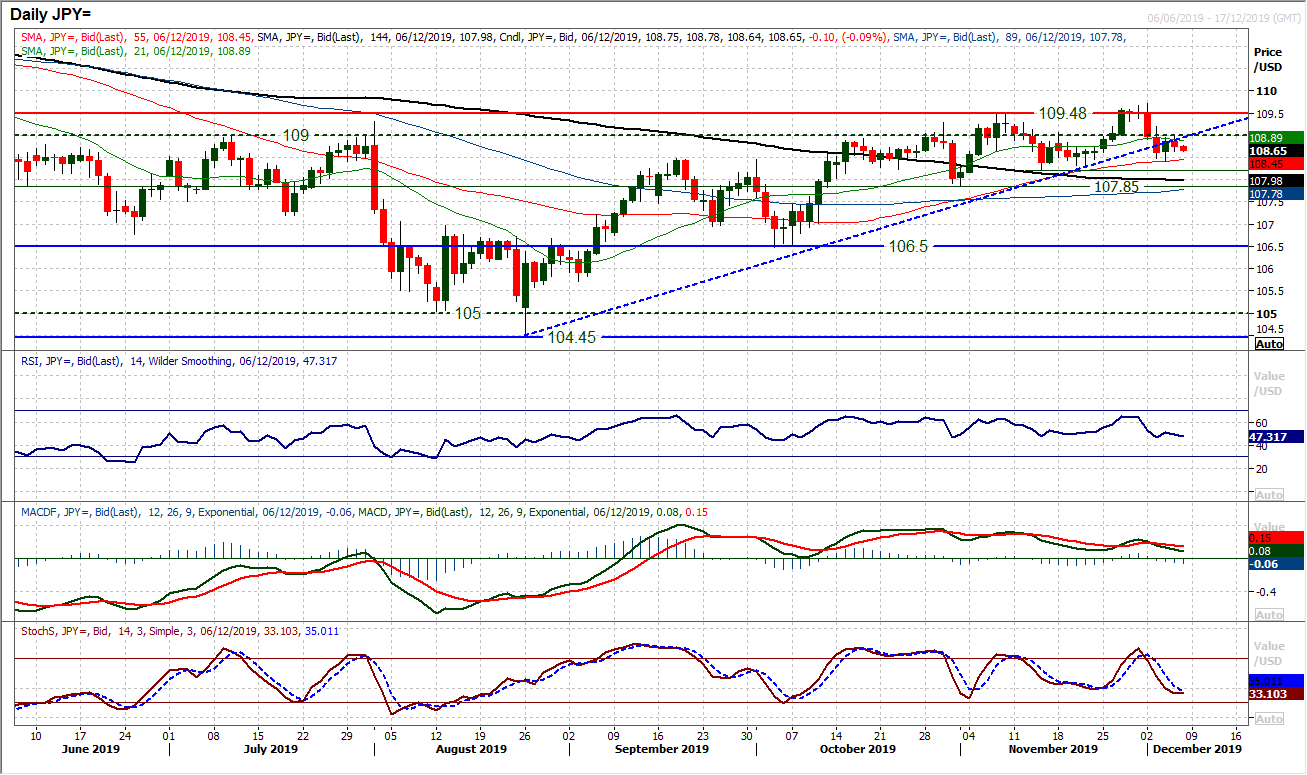
In breaking a 14 week uptrend the bulls have once more lost control. Once more an attempted breakout above 109.00 has failed. It is also interesting to see that the old 109.00 level has become resistance in the past couple of sessions as the bulls have struggled to re-assert themselves again. It is though important to say that there is still a run of higher lows that have helped to form the old uptrend. The rising 55 day moving average (today at 108.45) has been a basis of support throughout the past five weeks. We also see the momentum indicators marginally positively configured, with the RSI between 45/65, MACD above neutral and Stochastics consistently holding above 20. So whilst 108.25 (the first key higher low) remains intact, the bulls will still be in the driving seat (even if the engine keeps spluttering). A close back above 109.00 would re-open the 109.50/109.70 resistance.
Gold
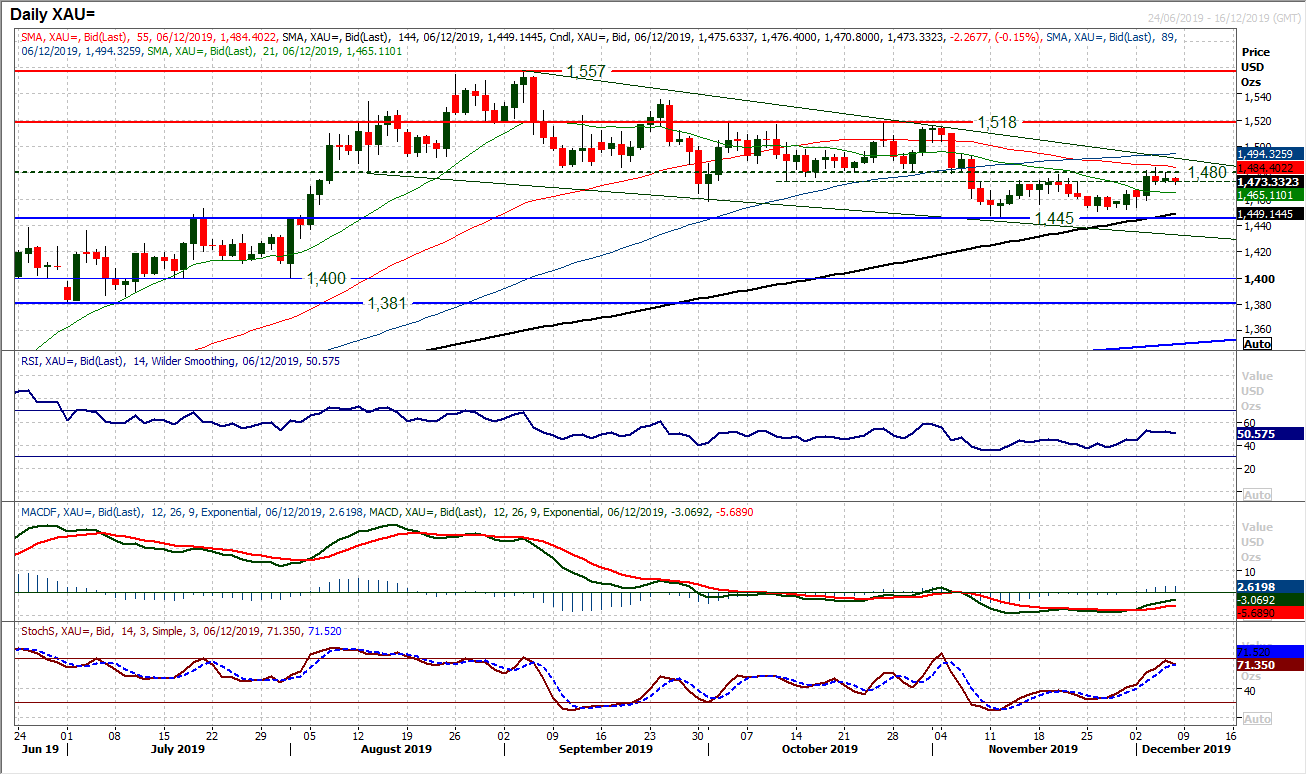
A traditional consolidation is forming ahead of the payrolls report today. The crucial factor though is that this consolidation is coming in the wake of a failed breakout above $1480 (a key area of overhead supply) in a move that has left resistance at $1484. It means that the direction garnered from the payrolls report today could be crucial in determining the near to medium term outlook. We see the daily RSI faltering in the low to mid-50s. Previous bull failures have come with RSI around 60, suggesting there could still be some further upside in recovery. A downtrend from the $1557 high sits at $1490 today, so again there could still be some upside to play out near term. However, the resistance around $1480 has been key for several weeks now and does not seem to be willing to give way. It would need a move above $1500 to really suggest the bulls are in a sustainable recovery. For today though, a decent payrolls would be gold negative. Another bull failure at or around $1480 with a renewed negative candle would be a key move to re-open the $1445 support again. The hourly chart shows initial support around $1460/$1466.
WTI Oil
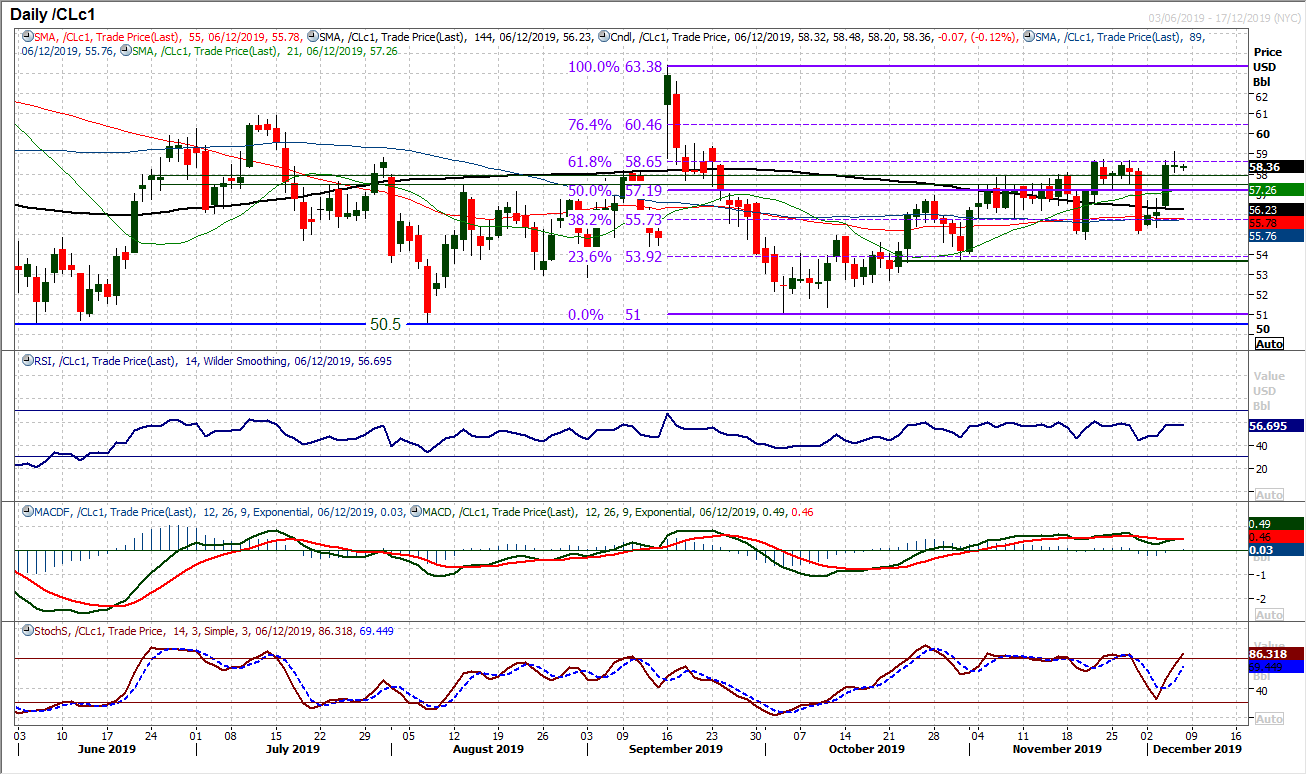
The oil bulls hardly got the news that they would have been hoping for out of the OPEC meeting yesterday. An increase in production cuts, but no extension to the length of the cuts. Gains have recently come with the expectation of an extension, so we have seen oil hovering in response. Perhaps we will see more from the OPEC+ meeting today (i.e. the meeting that includes Russia), but for now, the outlook for oil is unchanged. Yesterday’s break above resistance around the 38.2% Fib level around $58.65 could not hold and the bulls are back in a holding pattern today. There is a range that has formed in the past five weeks with momentum exhibiting the slightest edge of positive configuration. RSI is between 45/60 whilst MACD lines hold above neutral and Stochastics have swung higher again. There needs to be a closing breakout above $58.65 which would open the 23.6% Fib at $60.45. The continual concern that the bulls have though is that every time they look to have broken the shackles, they get dragged sharply back. It is making for very difficult trading on oil. Until the US/China “phase one” is penned, then this could continue.
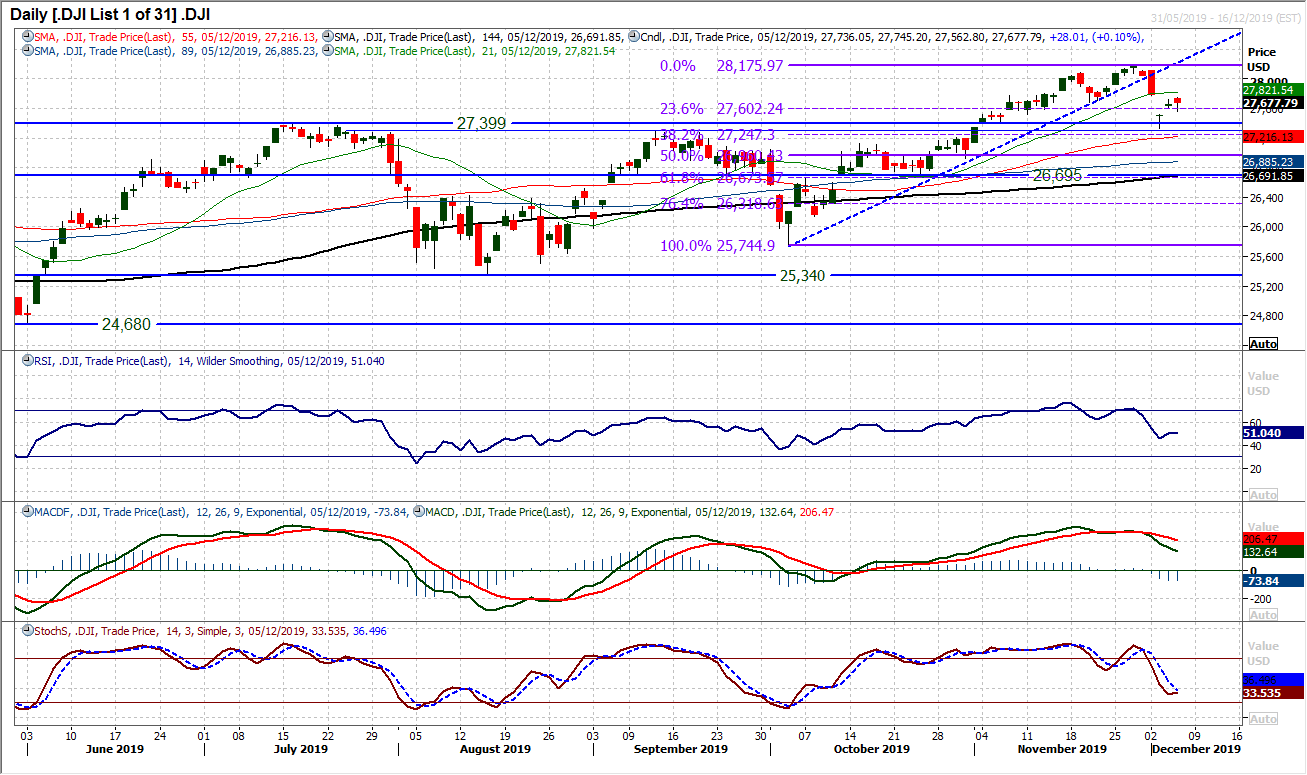
There is a distinct lack of confidence in the rebound of the past couple of sessions. Once more the Dow closed higher on the day, and once more with a cautious candlestick lacking conviction. We discussed yesterday the two gaps that were open, one at 27,525 and one at 27,782. Both gaps were looked at yesterday, but without being filled and again remain open. Given the market has now closed higher for two consecutive sessions, there is an element of recovery still playing out, but the bulls are not in a strong position. If the gap at 27,782 can be closed (the more likely move) then there will be a more positive look to the chart, however, we still see momentum indicators tentative, as the RSI hovers around 50, MACD lines continue to slip back from a bear cross and Stochastics also hold under neutral. The 23.6% Fibonacci retracement (of 25,745/28,175) around 27,600 is a noteworthy basis of support now and arguably 27,563 (yesterday’s low) could become a near term higher low. We will know more after payrolls today, but the recovery is tentative at best currently.
"""DISCLAIMER: This report does not constitute personal investment advice, nor does it take into account the individual financial circumstances or objectives of the clients who receive it. All information and research produced by Hantec Markets is intended to be general in nature; it does not constitute a recommendation or offer for the purchase or sale of any financial instrument, nor should it be construed as such.
All of the views or suggestions within this report are those solely and exclusively of the author, and accurately reflect his personal views about any and all of the subject instruments and are presented to the best of the author’s knowledge. Any person relying on this report to undertake trading does so entirely at his/her own risk and Hantec Markets does not accept any liability. """
