FX Brief:
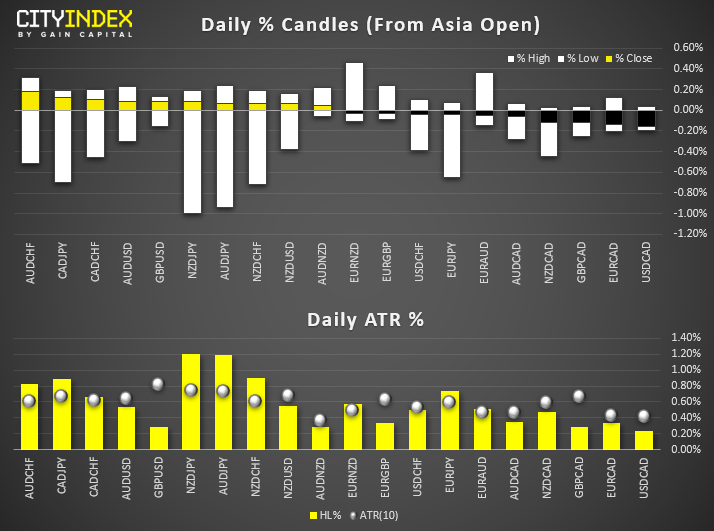
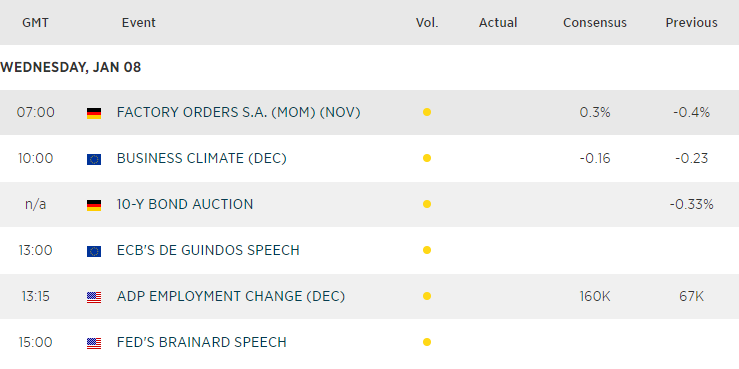
The main driver through Asia was reports that US bases were under attack across Iraq. Later confirmed by the Pentagon whilst Trump remained eerily silent, gold, and safe havens rose in tandem whilst US futures fell.Yet tensions receded once it was confirmed there were no casualties, and key markets performed a U-turn against earlier moves. Trump finally tweeted “all is well” and that he’ll release a statement tomorrow morning (US).For what it’s worth… Australian building approvals rebounded 11.8% in November, beating 2% forecast and up from -8.1% prior.Volatility was relatively high in Asia with the top-20 FX movers hitting around 90% of their ATR and several JPY pairs exceeding them. Under usual circumstances, we’d suggest they’re vulnerable to mean reversion. Yet as this has already occurred and markets now have large doji’s to deal with. This could make breakouts tricky unless markets run fully with risk-on this session (or, of course if Middle East tensions escalate once more).Price Action:
1600 remains a key level for gold traders. Assuming tensions don’t flare up, gold is expected to remain below this level and may provide an elongated bearish pinbar by the close (which is itself a warning of exhaustion at the highs). fell to its lowest level since August after yesterday’s bearish breakout. Bias remains bearish below 1.0390Like the S&P E-mini’s, currently shows a bullish pinbar on the daily timeframe. However, we’d urge caution to bulls whilst it trades below 109 as it remains beneath the 200-day eMA. has held up relatively well despite the risk-off sentiment earlier in the session. This leaves it vulnerable to mean reversion (so a minor bounce from current levels - at the very least).The initial breakdown on worked well yet, again, we see a large pinbar warning of a reversal. Near-term bias remains on intraday timeframes.Equities Brief:
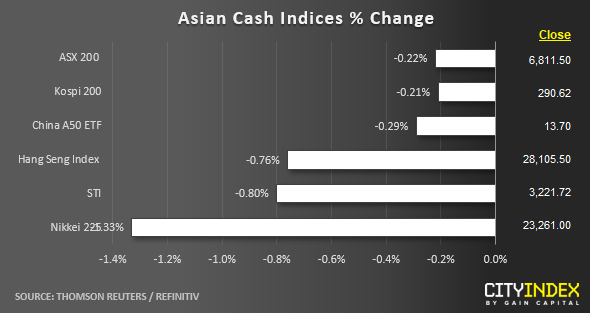
Key Asian stock markets are still trading in red with Middle East’s geopolitical risk on the radar screen after Iran has launched her first “physical” retaliation attacks towards U.S. via missiles strikes on Iraq bases.The major benchmark Asian stock indices have recovered most of their respective early Asian session losses after U.S. President Trump’s tweet that has stated “all is well” for the two damaged U.S. military bases in Iraq after the attack by Iran”. Trump will make an official statement later today, around the start of the U.S. session.South Korea’s Kospi 200 has remained quite resilient among the pack where it has so far slipped by only -0.17% supported by a rally of 2.5% on Samsung Electronics (LON:), the biggest component stock in the Kospi 200.The current upbeat performance on the share price of Samsung Electronics (LON:) has been reinforced by a more upbeat Q4 2019 earnings guidance where operating profit is likely to fall at a milder pace;7.1 trillion won versus a forecast of 6.4 trillion won based on analysts’ consensus. Samsung Electronics will report its Q4 2019 earnings on 29 Jan 2020.Price Acton (derived from CFD indices):
US SP 500: Mini V-shaped reversal after an intraday below 3195 (ascending trendline from 03 Oct 2019 low & Fibonacci retracement cluster) in today’s early Asian session (printed a current intraday low of 3181) and formed an impending daily “Hammer” candlestick at this juncture. Too early in the session for call for a clear-cut recovery, the V-shaped rebound from 3181 has now reached 61.8% retracement of recent slide from 07 Jan high to today, 08 Jan current Asian session low of 3181 which is at 3226 below the 07 Jan swing high area of 3250.Japan 225: Managed to recover almost the entire loss earlier this morning after it hit an intraday low of 22944 in today’s Asian session. However, price action of the Index is still within a minor descending channel in place since 27 Dec 2019 high with the channel resistance coming in at 23500. No clear signs of a recovery yet.Hong Kong 50: The current rebound from today’s Asian session current intraday low of 27825 has covered the gapped down seen at the start of today’s opening session with the gap resistance at 28220. It has formed an impending hourly “Doji” candlestick pattern which represents hesitation from the bulls to push prices higher. A break with an hourly close below 27900 opens up scope for a further potential slide towards 27200/100 support next.Australia 200: Continued to churn within a medium-term range configuration in place since 29 Nov 2019. Minor support now rests at 6740 with resistance remains at 6890; the top of the medium-term range configuration."Disclaimer: The information and opinions in this report are for general information use only and are not intended as an offer or solicitation with respect to the purchase or sale of any currency or CFD contract. All opinions and information contained in this report are subject to change without notice. This report has been prepared without regard to the specific investment objectives, financial situation and needs of any particular recipient.
Any references to historical price movements or levels is informational based on our analysis and we do not represent or warrant that any such movements or levels are likely to reoccur in the future. While the information contained herein was obtained from sources believed to be reliable, the author does not guarantee its accuracy or completeness, nor does the author assume any liability for any direct, indirect or consequential loss that may result from the reliance by any person upon any such information or opinions."
Original Post


