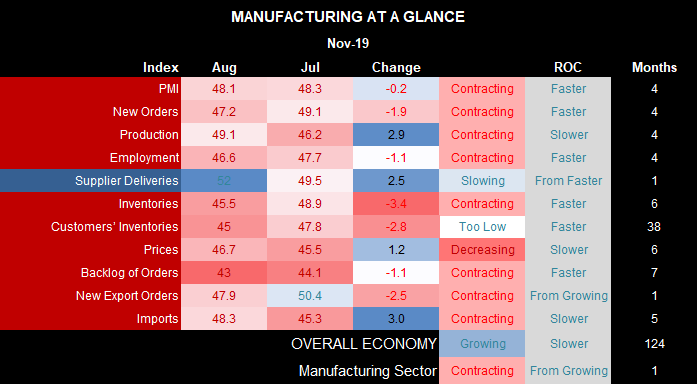
It was another sea of red where the ISM manufacturing report was concerned. The S&P500 took notice.
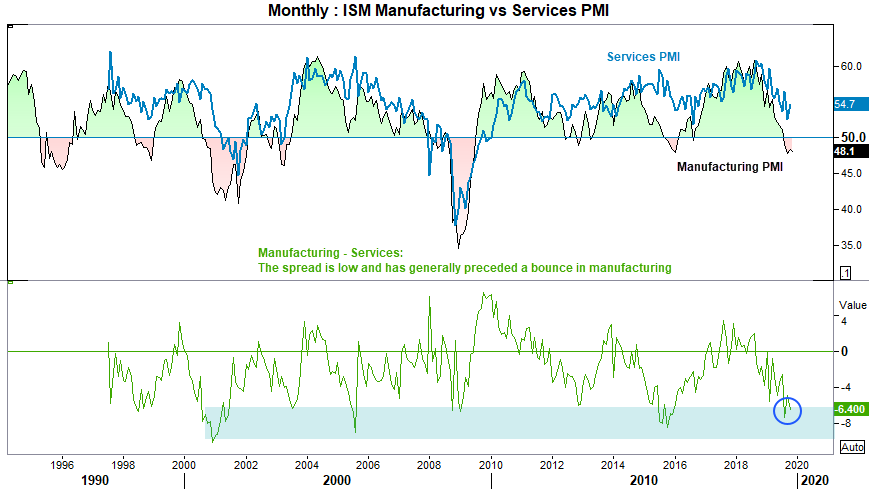
The market reaction said it all; USD/JPY fell from its highs, equities took a tumble and gold was bid whilst markets become concerted we could be headed for a recession. ISM manufacturing has been a closely watched report for decades, given its ability to lead growth and therefore, signal the potential for recession months in advance. Yet as previously highlighted, the US (and global) economy is increasingly shifting its focus over to the services sector. Moreover, the service sector continues to expand and it would have to drop quite sharply to close the gap with manufacturing and signal a broader, economic downturn. Whilst this doesn’t undermine the importance of manufacturing, we need to remain mindful that the US economy could be headed towards a manufacturing recession and not necessarily a full-blown one. Take note that ISM non-manufacturing read is out tomorrow.
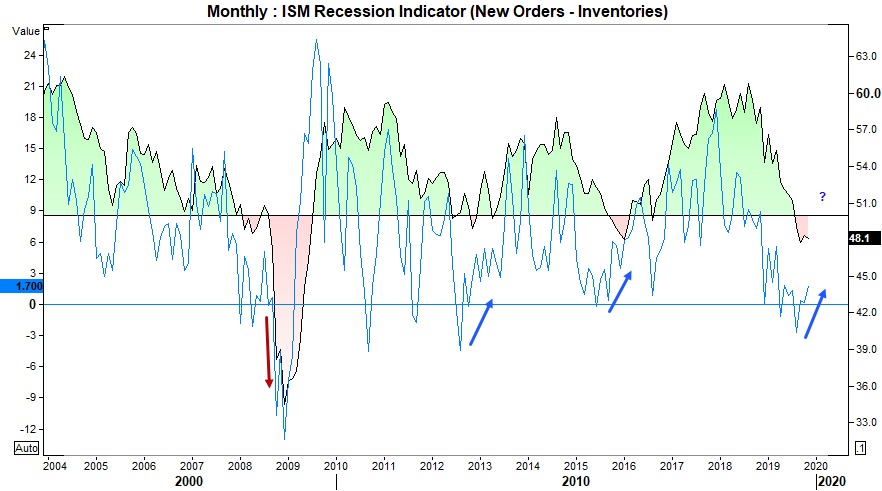
Is ISM manufacturing about to trough? Another metric we follow is the spready between manufacturing new orders – inventories. Dubbed the ISM recession indicator, the idea is we’d want to see both the headline PMI and spread in negative territory to improve the odds a recession is imminent. Yet we see new orders is outperforming inventories, which is keeping the spread above zero. Sure, it’s a messy indicator which sees the spread decline whilst ISM was elevated, or the ISM contract whilst the spread remain positive. Yet it does a god job of providing a ‘reality check’. Combine this, with the fact that ISM Non-manufacturing remains firmly in expansion territory, then perhaps the current decline in ISM manufacturing is noise and more likely to be another blip over a full-blown recession.
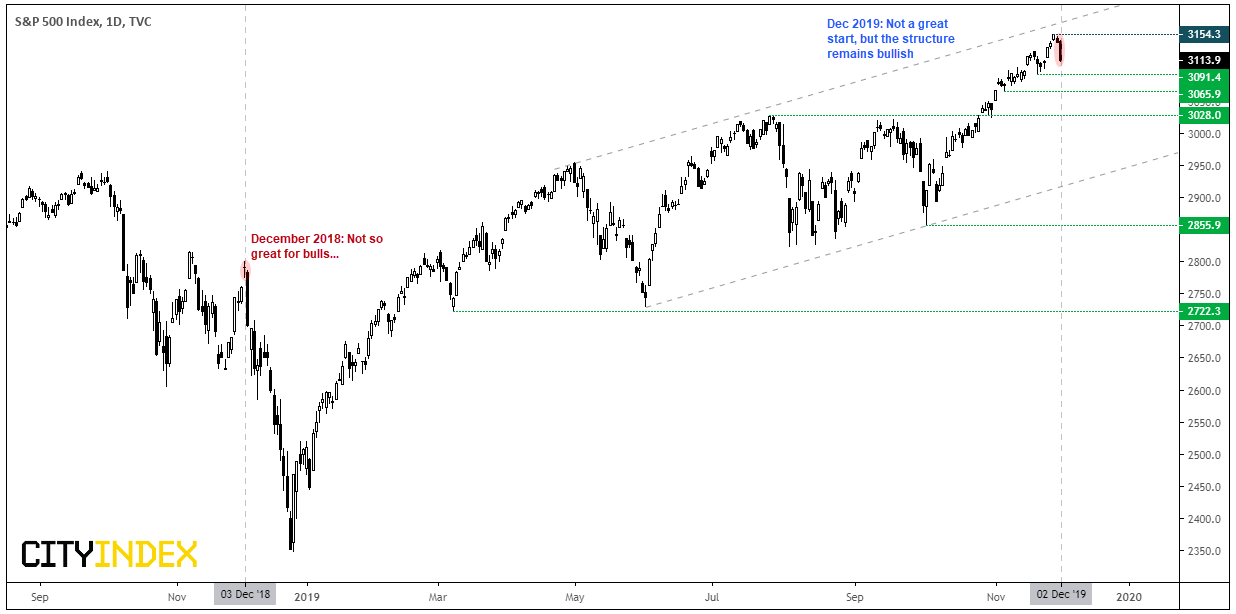
For once, the S&P500 took notice of some fundamental data and traded lower for the session, although Trump’s threat to restore steel and aluminum tariffs on Brazil and Argentina also played a part. However, given yesterday’s selloff was its most bearish close in 2 months, it begs the following question:
Will this December be as turbulent (and bearish) as December 2018? Last year, December opened with a Rikshaw man doji below resistance, before embarking upon a -16% slide over the next fourteen session. If a similar move were to unfold, the S&P500 could be trading around 2,640 by the 20th December. Whilst it recovered 6% into the close of the year, it was hardly the Santa’s rally many envisaged.
Perhaps it will be different this time… Over the long-term, December is traditionally a strong month for equities, and famously dubbed Santa’s rally. But we also find ourselves just off record highs and price action was extended beyond the upper Keltner band to warn of the need of a pullback. Whereas last year the market has already topped in September before oscillating in a volatile range, leading into December. Therefore, we can’t quite make a direct comparison based around December’s price action.
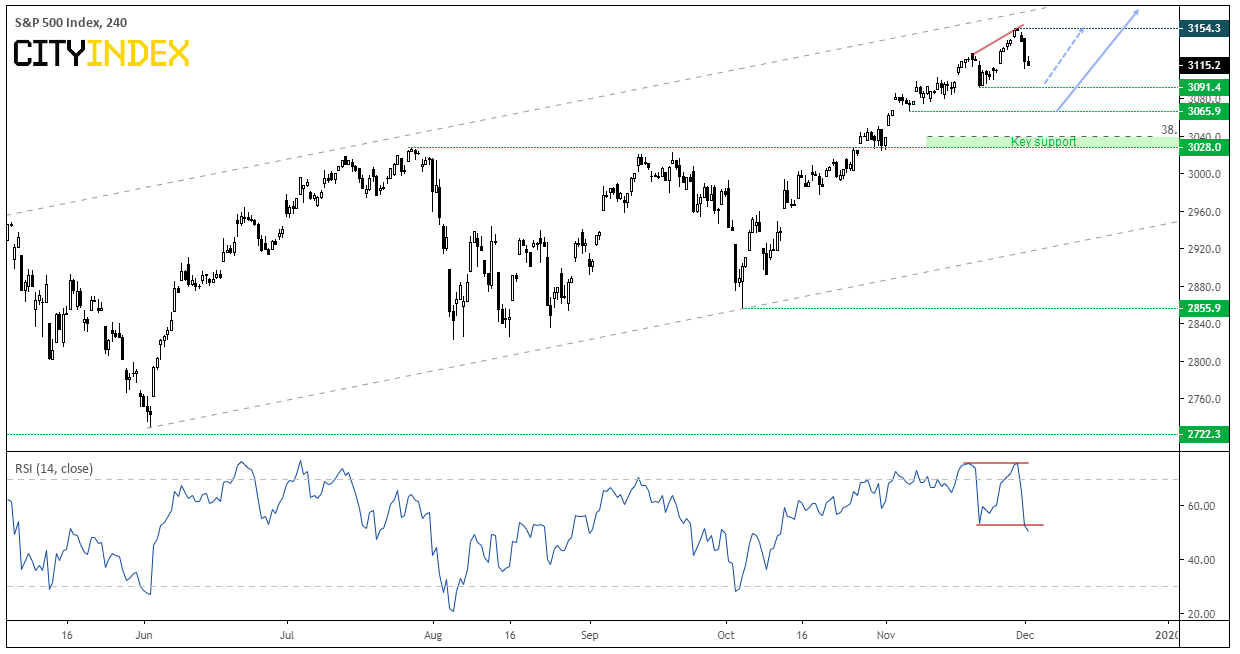
Still, it appears an interim top is in place.
Related Analysis:December Brings the Volatility!
S&P500: The Long And Short Of It | AMD, United Technologies (NYSE:UTX), Apache, NiScource
ISM Services PMI: A Few Worrying Signs Yet With Some Positives Too | S&P500
The Closer You Look At ISM's PMI, The Uglier It Gets | EUR/USD, USD/CHF
"Disclaimer: The information and opinions in this report are for general information use only and are not intended as an offer or solicitation with respect to the purchase or sale of any currency or CFD contract. All opinions and information contained in this report are subject to change without notice. This report has been prepared without regard to the specific investment objectives, financial situation and needs of any particular recipient.
Any references to historical price movements or levels is informational based on our analysis and we do not represent or warrant that any such movements or levels are likely to reoccur in the future. While the information contained herein was obtained from sources believed to be reliable, the author does not guarantee its accuracy or completeness, nor does the author assume any liability for any direct, indirect or consequential loss that may result from the reliance by any person upon any such information or opinions."
