Invesco Asia Trust (LON:IAT) posted a one-year NAV total return (TR) to end-May 2024 of 3.8%, below its benchmark return of 8.7%, as some of IAT’s Chinese stock picks de-rated significantly over the period. That said, IAT’s managers remain confident in their current Chinese holdings (and the trust’s overweight position to China/Hong Kong), as they believe that the widespread weakness in local equities has allowed them to build a portfolio of high-quality names at attractive valuations. IAT also remains overweight South Korea, and the trust could benefit from the recently announced government initiative aimed at enhancing the appeal of local equities through reforms to corporate governance and enhanced distributions to shareholders (inspired by the recent success in Japan).
Below-average price tag for Asian growth stories
A portfolio of equities in emerging and developing Asia may benefit from secular tailwinds supporting economic growth above the global average across several countries in the region. These drivers include, among other things, growth in consumer spending, a strong position in the global tech value chain, changes in global supply chains (benefiting some Asian countries beyond China) as well as decarbonisation. The current valuation levels, which are below historical averages in several countries, provide good opportunities for active, valuation-aware investors to outperform a passive Asian equities portfolio.
Remaining consistent in its contrarian approach
IAT’s higher allocation to China/Hong Kong (the highest in its close peer group) and underweight position in India come from its unconstrained, contrarian, bottom-up strategy of looking for mispriced, quality businesses with strong balance sheets, which should outperform over the next three to five years. As a result, it is well-positioned for a scenario in which good-quality Chinese equities re-rate from depressed levels, while at the same time it is less exposed to a possible retracement in Indian equities valuations following a period of strong investor sentiment. IAT’s shares trade at a c 11% discount to its NAV including income, which is broadly in line wider the five and 10-year averages.
NOT INTENDED FOR PERSONS IN THE EEA
Asian valuations remain undemanding and dispersed
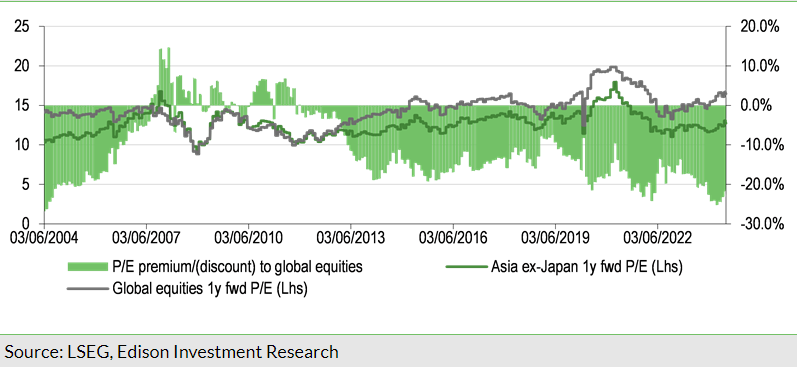
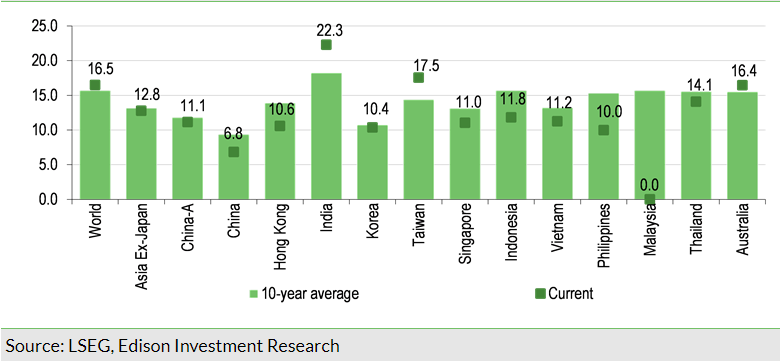
The valuation gap between the Asia ex-Japan region and global equities (based on a one-year forward P/E ratio for Datastream indices) remains wide at c 23%, above the 10-year average of c 16% (see Exhibit 1). The gap comes from modestly higher valuations of global equities (16.5x vs a 10-year average of 15.7x), while valuations in Asia ex-Japan are 3% below the 10-year average of 13.2x. We also note the continued significant dispersion in valuations across the region, with markets such as India and Taiwan trading above the 10-year historical average, while several other markets, including China and Hong Kong, are trading below the 10-year average based on one-year forward P/E ratios (see Exhibit 2).
The undemanding valuations relative to global equities should be put in the context of good earnings growth prospects in the region, with the expected 12-month EPS growth estimate (as per LSEG data) for the Asia ex-Japan region now at 27% y-o-y. The MSCI Asia ex-Japan Index traded at 1.6x price-to-book ratio (P/BV) at end-March 2024, a level at which IAT’s managers estimate historically resulted in an average five-year prospective compound annual return of 8.7%, which, together with alpha from IAT’s unconstrained, bottom-up investment strategy, offer the prospects of potentially solid mid- to long-term returns.
IAT still sees more opportunities in China than India
Different macro outlook contributes to the valuation gap…
The most significant valuation disparity is between Chinese and Indian equities. IAT’s managers highlighted recently that around one-third of the MSCI India Index constituents currently trade at one-year forward P/E ratios above 30x, and two-thirds at multiples above 20x. This compares with nearly 90% of the MSCI China Index constituents trading below 20x, with half trading below 10x.
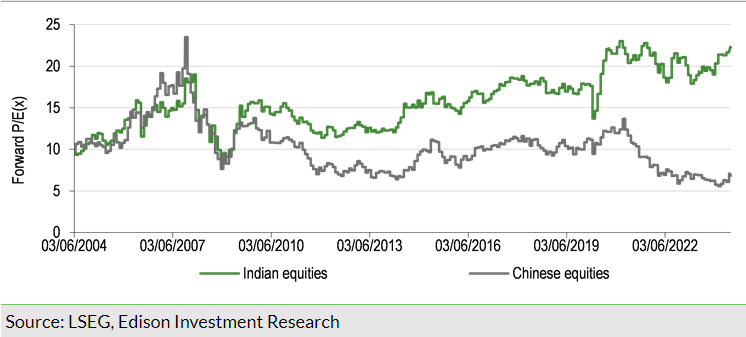
Important contributors to this have been the weak Chinese economy (including its property market crisis and subdued consumer sentiment), the change in local regulations and US-China political tensions. The IMF highlights China’s public debt dynamics as a concern, especially if the property crisis triggers a local public finance crisis. Investor sentiment is also dampened by the fact that the Chinese government has had limited success so far in stimulating consumer spending and general economic growth. That said, we note that it has recently announced measures to support its property sector, which involve the purchase of unsold completed apartments from developers by local state-owned enterprises to convert them into social affordable housing (supported by CNY300bn in cheap central bank funding), the cancelling of the floor for mortgage rates, as well as a reduction in down-payment rates to 15%.
Meanwhile, India’s economic growth could benefit from an expanding manufacturing sector (supported by the shift in supply chains away from China), extensive infrastructure investments and a healthy banking sector. IAT’s managers note the greater earnings resilience of Indian companies compared to their Chinese counterparts in recent years. That said, they point to Tencent (HK:0700) (one of IAT’s top holdings, making up 7.5% of end-April 2024 portfolio value) as an example of a Chinese company whose earnings upgrades were accompanied by a declining share price last year. Tencent currently trades at a one-year forward P/E of 16.0x compared to a five-year average of 23.7x (based on LSEG consensus).
We note that, despite the above-mentioned macroeconomic headwinds, the IMF projected in its April World Economic Outlook report that China’s GDP will grow by 4.6% in 2024 and 4.1% in 2025 (with a gradual deceleration to c 3.3% by 2029), suggesting the country should continue to benefit from secular tailwinds such as structural growth in consumption, automation/digitalisation and the green transition, among other things. While this forecast growth is below the IMF’s growth expectations for India (6.8% and 6.5%, respectively), it is still well above its projections for advanced economies, including the US with forecast GDP growth of 2.6% and 1.8%, respectively. IAT’s managers also highlight the persistent growth in the disposable income of Chinese households (even if property availability remains moderate versus pre-2015 levels), as well as robust corporate balance sheets and free cash flow generation (with a 6.79% yield at 28 February 2024, according to Invesco, based on FactSet data).
…which IAT as a contrarian investor seeks to benefit from
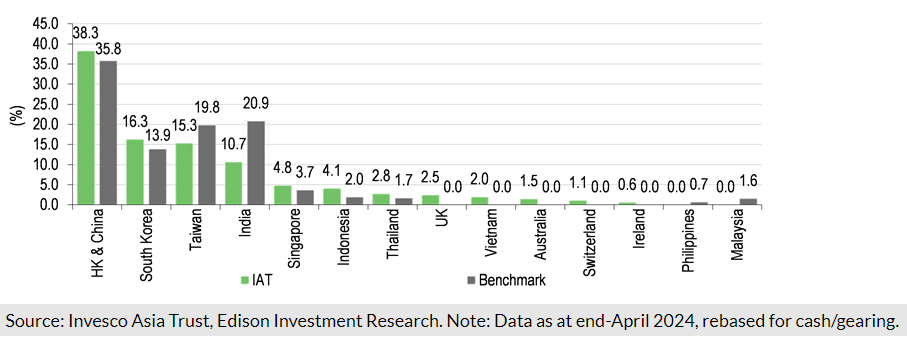
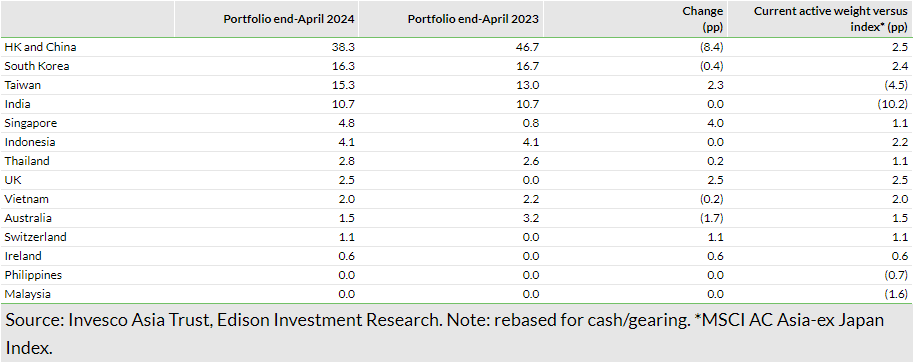
IAT is a contrarian investor looking for out-of-favour opportunities with solid fundamentals that trade at undemanding valuations. The greater number of value opportunities in China versus India, coupled with IAT’s bottom-up, disciplined stock selection process, result in a continued overweight to China/Hong Kong equities, with an active weight versus the benchmark of c 2.5pp (although its absolute weight declined by 8.4pp y-o-y), see Exhibit 4. The managers highlight that the de-rating of Chinese stocks (including consumer and property-related stocks) has been broad-based and indiscriminate, which has allowed them to increase the quality of IAT’s Chinese portfolio without having to increase the overweight position. Recent portfolio changes include the sale of Will Semiconductor, following its solid stock performance in 2023, as IAT’s managers see greater upside potential elsewhere in China and Hong Kong. Moreover, they sold the wind turbines manufacturer Ming Yang Smart Energy, as the company faced a tougher competitive environment than three years ago, prompting it to develop wind farms (a more capital-intensive business), and in turn triggering a change to its investment case. Premium beer producer China Resources Beer was bought to benefit from the structural premiumisation of the Chinese beer market, as the company traded at a low P/E ratio compared to historical levels.
Retaining its lower allocation to India
IAT’s overweight position to China/Hong Kong is coupled with a continued significant underweight position in India of c 10pp (with an end-April 2024 weight of 10.7%). IAT contrasts its underweight exposure to Indian stocks with an overweight position in Indonesia (c 4.1% of portfolio, 2.2pp active weight at end-April 2024) given the significant divergence in valuations between these markets and Indonesia’s growth potential stemming from, among other things, a positive commodity cycle, public infrastructure investments and a current account surplus. IAT’s managers recently took the opportunity arising from a correction in the share price of Telkom Indonesia, the largest Indonesian telecommunications company, to buy into the stock.
IAT still explores Indian opportunities, as illustrated by its recent investment in logistics company Delhivery, which the managers perceive as well-positioned for the scaling up of India’s nationwide logistics sector for the first time since the introduction of the Goods and Services Tax reform. Interestingly, IAT’s negative country allocation effect stemming from its underweight position in the well-performing Indian market was more than offset by good stock selection in the country in the 12 months to end-December 2023.
Positioning to South Korea’s ‘corporate value-up’
Government seeking to improve investor confidence
IAT considers South Korea (to which it was overweight in 2023 and in 2024 to date) as relatively cheap and believes that the discount (currently at c 19% to the broader Asia ex-Japan region based on LSEG data) overstates corporate governance concerns, geopolitical risk and the economy’s cyclicality.
On 26 February 2024, the South Korean government unveiled the ‘Corporate Value-Up Programme’ to address the discount at which local businesses trade to their global peers and potentially repeat Japan’s recent success in improving investor sentiment on the back of reforms to corporate governance of local businesses. Under the programme, the government encourages local companies to voluntarily return more capital to shareholders and improve governance, including a reduction of crossholdings between entities of large, opaque conglomerates. A particular emphasis is placed on a company’s return on equity and P/BV multiple versus industry and peers, with those fairing better to be included in a premium index tracked by exchange traded funds. Moreover, the programme may involve changes to the rules on treasury shares of listed companies to protect minority shareholders. On 2 May, the local financial regulator proposed detailed guidelines for companies that choose to participate in the government’s reform programme.
Given the recent defeat of the ruling party in the national assembly elections, the Corporate Value-Up Programme is now less likely to be accompanied by tax incentives, such as a reform of the local inheritance tax, which is currently charged at a 65% rate for assets over KRW100bn (c US$75m) and often applies to the so-called ‘chaebols’ (ie family-controlled conglomerates). This tax discourages family owners from driving up the value of their businesses when they plan a generational ownership change.
We also note some investors’ disappointment over the fact that the programme is meant to be entirely voluntary. Consequently, following the announcement the broader MSCI Korea Index outperformed the MSCI AC Asia ex-Japan Index until early April 2024 (with some stocks that pay a high dividend and/or trade at low P/BV benefiting significantly), but then retraced and its year-to-date performance in US dollar terms of c -3.9% is now below the c 7.5% for the broader Asian index.
Focus on a narrow set of the most promising businesses
IAT’s managers note that South Korean companies’ dividend growth has been above the broader regional average for several years now. An example of a solid Korean dividend payer in IAT’s portfolio is Samsung Fire and Marine Insurance (2.7% of the portfolio at end-April 2024), which IAT invested into in 2020 and has enjoyed a strong return from to date, well above 50% in local currency terms (this holding was one of the major positive contributors in Q124). IAT’s managers highlight that the company’s solid earnings growth, coupled with a proactive shareholder return policy, currently imply a 5.5%+ dividend yield.
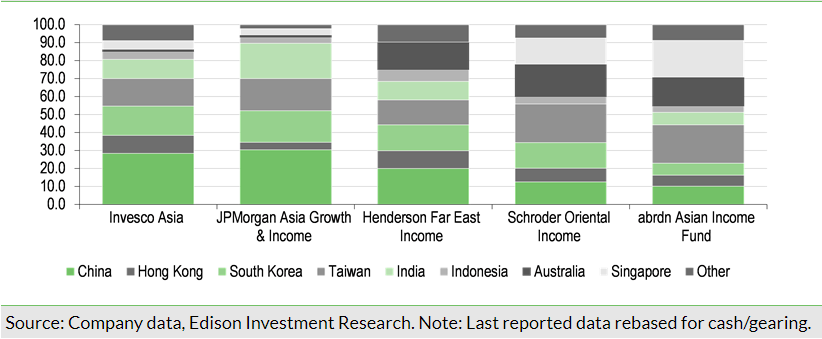
South Korea’s weight in IAT’s portfolio (adjusted for cash/gearing) stood at 16.3% at end-April 2024 (c 2.4pp above the benchmark), one of the highest among its close peers (see Exhibit 5). IAT’s managers intend to focus on a narrower set of high-conviction names that are more likely to benefit from the ‘Corporate Value-Up’ Programme, which led them to sell auto parts manufacturer Hyundai Mobis. Meanwhile, IAT’s managers initiated a new position in KB Financial Group as it has been trading at a P/BV multiple of 0.45x, which the managers believe is partly due to non-fundamental reasons, including the ownership limits of the South Korean public pension fund National Pension Service. The trust’s existing South Korean holdings include Samsung Electronics (LON:0593xq) (7.6% of end-April 2024 portfolio), memory semiconductor producer SK Hynix (2.4%), the above-mentioned Samsung Fire and Marine Insurance, as well as LG Chemical, Hyundai Motor Corporation and LG Household & Healthcare.
Tech remains a key theme
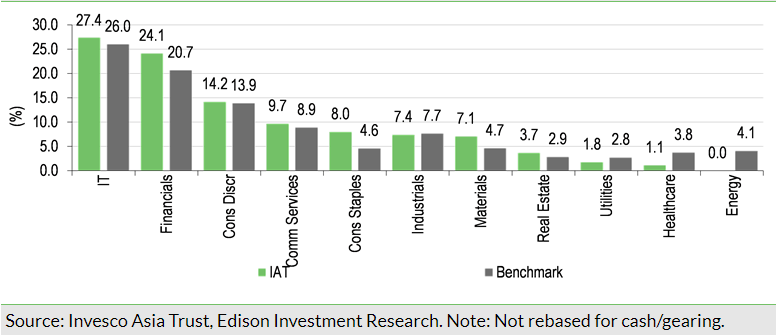
One of IAT’s focus areas remains technology, its largest sector exposure at 27.4% at end-February 2024 (last available data, broadly in line with benchmark) through its South Korean and Taiwanese holdings (TSMC, Samsung Electronics, SK Hynix, Mediatek). Interestingly, IAT’s managers believe that the level of demand for semiconductors arising from the growth in AI has not been fully priced into some of the mega-cap Asian tech stocks. Moreover, the managers remain holders of the potential AI beneficiaries as they note the recent reduction in excess inventory in the supply chain for PCs, mobiles and servers which is translating into rising shipments and improving margins. They consider these developments an important earnings driver, supporting IAT’s targeted double-digit returns for its holdings, even assuming a limited contribution from the AI theme.
Another important theme is sustained credit growth and demand for insurance products in Asia. IAT’s overweight position in financials has recently increased further, bringing its allocation to 24.1% at end-February 2024 compared to 20.7% for the benchmark. IAT recently added KB Financial Group to its portfolio, as highlighted above. Within this sector, IAT places emphasis on well-capitalised businesses with strong core profitability, which may be considered consumer proxies and could benefit from the recent interest rate normalisation. It holds banks and non-bank lenders operating in countries with potential for sustained acceleration of credit growth (see our previous review note for details).

One-year performance hit by Chinese stock allocation
IAT posted a one-year NAV TR in sterling terms to end-May 2024 of 3.8%, underperforming the MSCI Asia Ex-Japan Index, which posted an 8.7% return. We understand that this came from, among other factors, a weak stock allocation effect in China, including a significant share price de-rating of catering group Jiumaojiu International Holdings, auto dealer China MeiDong Auto Holdings, Beijing Capital International Airport, as well as provider of renewable energy solutions Ming Yang Smart Energy Group (which was recently sold, as mentioned above). That said, we note that IAT’s stock selection in China contributed positively to its Q124 returns. Hong Kong has seen worsening macroeconomic conditions and there were three major local detractors among IAT’s holdings in the period: AIA Group, CK Asset Holding and Link REIT. Positive contributors across IAT’s portfolio included names such as Aurobindo Pharma, SK Hynix, Shriram Finance and Samsung Electronics. Aurobindo was recently sold on valuation grounds at a forward P/E of 18.0x.
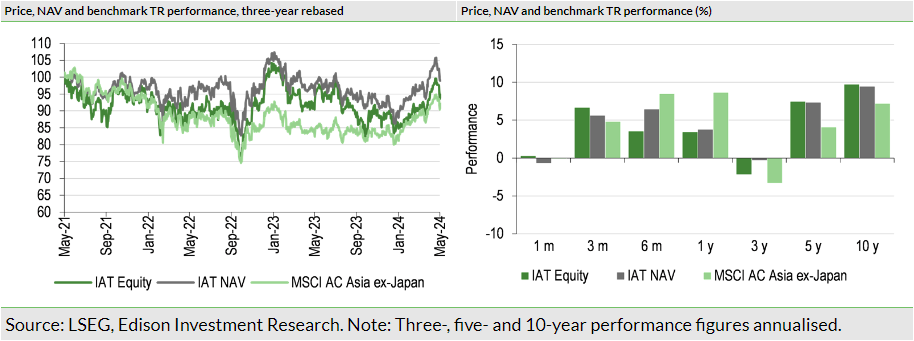

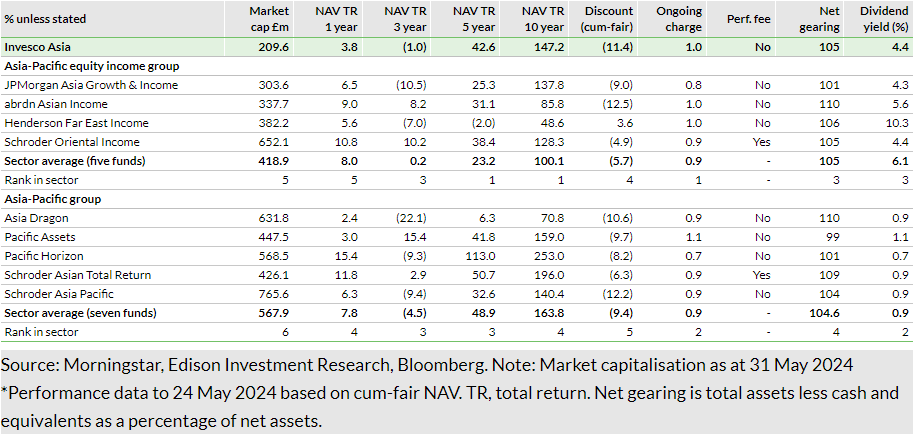
Over the last three years, IAT’s NAV declined by 1.0% on a total return basis, which was visibly ahead of the benchmark return of -9.6%. IAT’s three-year NAV TR was slightly below the peer average, mostly due to the better results of abrdn Asian Income Fund and Schroder Oriental Income, which were assisted by their focus on income (recent years were less favourable for growth stocks and IAT has a balanced focus on growth and income) and their lower exposure to the Chinese equity market (which overall has a large weight of growth stocks that do not pay dividends). However, IAT maintains the long-term outperformance of its benchmark and peer average, with five- and 10-year NAV TRs of c 7.4% and 9.5% pa, respectively, compared to 4.1% and 7.2% for MSCI Asia ex-Japan, respectively (see Exhibit 9), and 4.3% and 7.2% on average for its peers, respectively (see Exhibit 10).
IAT’s mid- to long-term returns are somewhat below the AIC Asia Pacific peer group average, though we note that this is due to both Pacific Assets and Pacific Horizon being more growth-orientated and having a greater proportion of small- and mid-cap companies in their portfolios. Therefore, they are not fully comparable with IAT. They also have a much higher allocation to India, which IAT’s managers now consider a quite expensive equity market (see above). Finally, we note that IAT’s dividend yield of 4.4% is well above the Asia-Pacific group average. IAT’s portfolio at end-February 2024 was characterised by an average dividend yield of 2.9%, slightly above the 2.6% of the MSCI Asia ex-Japan Index and well above both MSCI World (1.9%) and S&P500 (1.5%).
_____________________________________________
General disclaimer and copyright
This report has been commissioned by Invesco Asia Trust and prepared and issued by Edison, in consideration of a fee payable by Invesco Asia Trust. Edison Investment Research standard fees are £60,000 pa for the production and broad dissemination of a detailed note (Outlook) following by regular (typically quarterly) update notes. Fees are paid upfront in cash without recourse. Edison may seek additional fees for the provision of roadshows and related IR services for the client but does not get remunerated for any investment banking services. We never take payment in stock, options or warrants for any of our services.
Accuracy of content: All information used in the publication of this report has been compiled from publicly available sources that are believed to be reliable, however we do not guarantee the accuracy or completeness of this report and have not sought for this information to be independently verified. Opinions contained in this report represent those of the research department of Edison at the time of publication. Forward-looking information or statements in this report contain information that is based on assumptions, forecasts of future results, estimates of amounts not yet determinable, and therefore involve known and unknown risks, uncertainties and other factors which may cause the actual results, performance or achievements of their subject matter to be materially different from current expectations.
Exclusion of Liability: To the fullest extent allowed by law, Edison shall not be liable for any direct, indirect or consequential losses, loss of profits, damages, costs or expenses incurred or suffered by you arising out or in connection with the access to, use of or reliance on any information contained on this note.
No personalised advice: The information that we provide should not be construed in any manner whatsoever as, personalised advice. Also, the information provided by us should not be construed by any subscriber or prospective subscriber as Edison’s solicitation to effect, or attempt to effect, any transaction in a security. The securities described in the report may not be eligible for sale in all jurisdictions or to certain categories of investors.
Investment in securities mentioned: Edison has a restrictive policy relating to personal dealing and conflicts of interest. Edison Group does not conduct any investment business and, accordingly, does not itself hold any positions in the securities mentioned in this report. However, the respective directors, officers, employees and contractors of Edison may have a position in any or related securities mentioned in this report, subject to Edison's policies on personal dealing and conflicts of interest.
Copyright: Copyright 2024 Edison Investment Research Limited (Edison).
Australia
Edison Investment Research Pty Ltd (Edison AU) is the Australian subsidiary of Edison. Edison AU is a Corporate Authorised Representative (1252501) of Crown Wealth Group Pty Ltd who holds an Australian Financial Services Licence (Number: 494274). This research is issued in Australia by Edison AU and any access to it, is intended only for "wholesale clients" within the meaning of the Corporations Act 2001 of Australia. Any advice given by Edison AU is general advice only and does not take into account your personal circumstances, needs or objectives. You should, before acting on this advice, consider the appropriateness of the advice, having regard to your objectives, financial situation and needs. If our advice relates to the acquisition, or possible acquisition, of a particular financial product you should read any relevant Product Disclosure Statement or like instrument.
New Zealand
The research in this document is intended for New Zealand resident professional financial advisers or brokers (for use in their roles as financial advisers or brokers) and habitual investors who are “wholesale clients” for the purpose of the Financial Advisers Act 2008 (FAA) (as described in sections 5(c) (1)(a), (b) and (c) of the FAA). This is not a solicitation or inducement to buy, sell, subscribe, or underwrite any securities mentioned or in the topic of this document. For the purpose of the FAA, the content of this report is of a general nature, is intended as a source of general information only and is not intended to constitute a recommendation or opinion in relation to acquiring or disposing (including refraining from acquiring or disposing) of securities. The distribution of this document is not a “personalised service” and, to the extent that it contains any financial advice, is intended only as a “class service” provided by Edison within the meaning of the FAA (i.e. without taking into account the particular financial situation or goals of any person). As such, it should not be relied upon in making an investment decision.
United Kingdom
This document is prepared and provided by Edison for information purposes only and should not be construed as an offer or solicitation for investment in any securities mentioned or in the topic of this document. A marketing communication under FCA Rules, this document has not been prepared in accordance with the legal requirements designed to promote the independence of investment research and is not subject to any prohibition on dealing ahead of the dissemination of investment research.
This Communication is being distributed in the United Kingdom and is directed only at (i) persons having professional experience in matters relating to investments, i.e. investment professionals within the meaning of Article 19(5) of the Financial Services and Markets Act 2000 (Financial Promotion) Order 2005, as amended (the "FPO") (ii) high net-worth companies, unincorporated associations or other bodies within the meaning of Article 49 of the FPO and (iii) persons to whom it is otherwise lawful to distribute it. The investment or investment activity to which this document relates is available only to such persons. It is not intended that this document be distributed or passed on, directly or indirectly, to any other class of persons and in any event and under no circumstances should persons of any other description rely on or act upon the contents of this document.
This Communication is being supplied to you solely for your information and may not be reproduced by, further distributed to or published in whole or in part by, any other person.
United States
Edison relies upon the "publishers' exclusion" from the definition of investment adviser under Section 202(a)(11) of the Investment Advisers Act of 1940 and corresponding state securities laws. This report is a bona fide publication of general and regular circulation offering impersonal investment-related advice, not tailored to a specific investment portfolio or the needs of current and/or prospective subscribers. As such, Edison does not offer or provide personal advice and the research provided is for informational purposes only. No mention of a particular security in this report constitutes a recommendation to buy, sell or hold that or any security, or that any particular security, portfolio of securities, transaction or investment strategy is suitable for any specific person.
London │ New York │ Frankfurt
20 Red Lion Street
London, WC1R 4PS
United Kingdom
